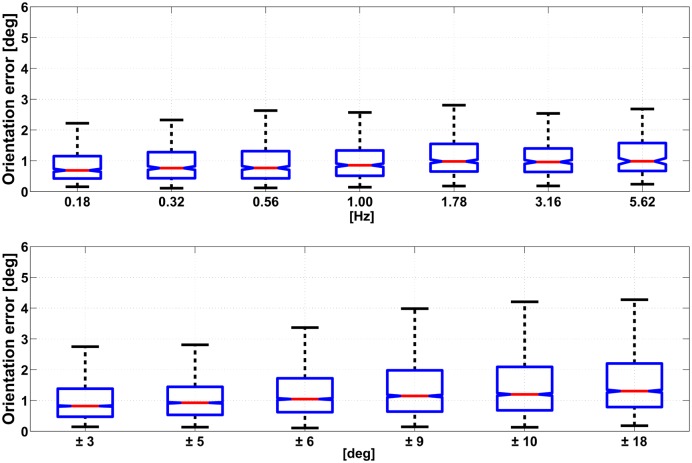
Fig 6. The figure reports the trend in the absolute orientation error computed with the KF, for varying movement frequency (top) and range of motion (bottom).
Data are represented as the median value (red line), IQR (blue box) and minimum and maximum values (black whiskers). Outliers are removed from each dataset using a ±3 IQR threshold: respectively 55 and 53 datapoints out of 19440 from the top and the bottom graph.

