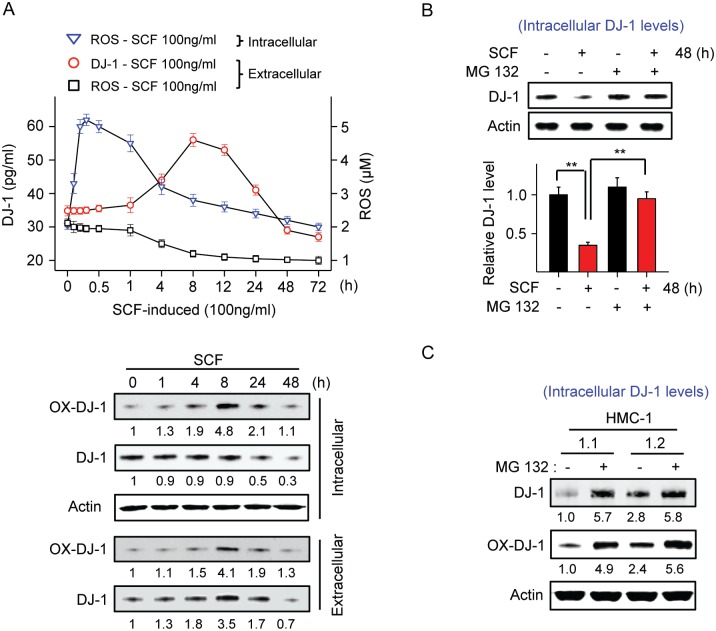
Fig 3. Activation of KIT by SCF induces ROS production and DJ-1 oxidation followed by both DJ-1 release and degradation.
(A) Changes in intra- and extracellular ROS and release of DJ-1 into the media (measured by ELISA) in LAD2 cultures after treatment with SCF (100 ng/ml) for the indicated times. The lower panels are immunoblots showing changes in total DJ-1 and oxidized DJ-1 (at Cys 106) inside cells or secreted to the media, as indicated. Shown under the blots are their average relative band intensities (corrected by β-actin intensity) as compared to non-stimulated HMC1.2 cells (n = 3; SDs were less than 10% of the mean). (B) Intracellular DJ-1 levels in LAD2 cells treated with 100 ng/ml SCF for 48 h in the presence or absence of the proteosomal inhibitor MG132 (10 μM) added 6 h prior to SCF stimulation. Intracellular levels of DJ-1 were determined by Western blot. The bar graph shows the average relative band intensities compared to untreated cells (n = 3). (C) Levels of intracellular (total and oxidized) DJ-1 after treatment of HMC-1 cells with the proteosomal inhibitor MG132 (10 μM) for 6 h. All experiments were repeated at least 3 times and data represents mean±SEM. *P<0.05 and **P<0.01.

