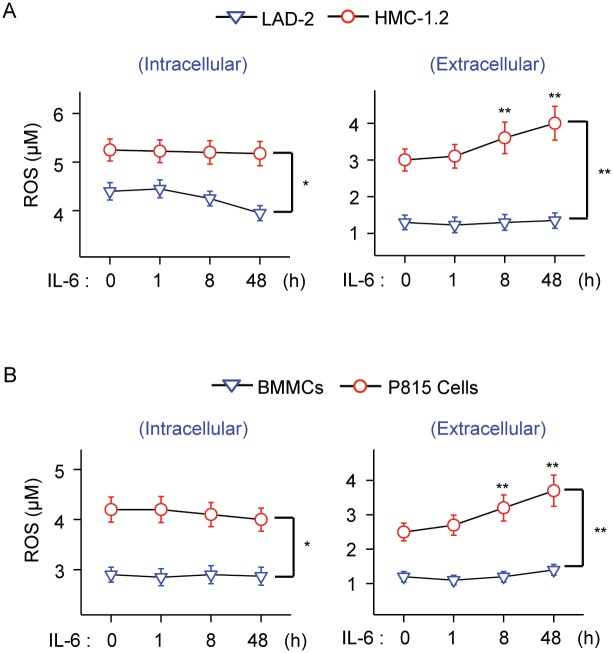
Fig 5. IL-6 increases extracellular ROS levels in HMC-1 cells.
(A) Changes in intracellular (left) and extracellular ROS (right) levels induced by IL-6 (50 ng/ml) in HMC-1.2 cells compared to LAD2 cells. LAD2 were pre-stimulated with SCF for 48 h (100 ng/ml) prior to IL-6 stimulation. (B) Changes in intracellular (left) and extracellular ROS (right) levels induced by 50 ng/ml IL-6 in P815 cells compared to normal BMMC. ROS was measured using a fluorescence assay. All experiments were repeated at least 3 times and data represents mean±SEM. *P<0.05 and **P<0.01.

