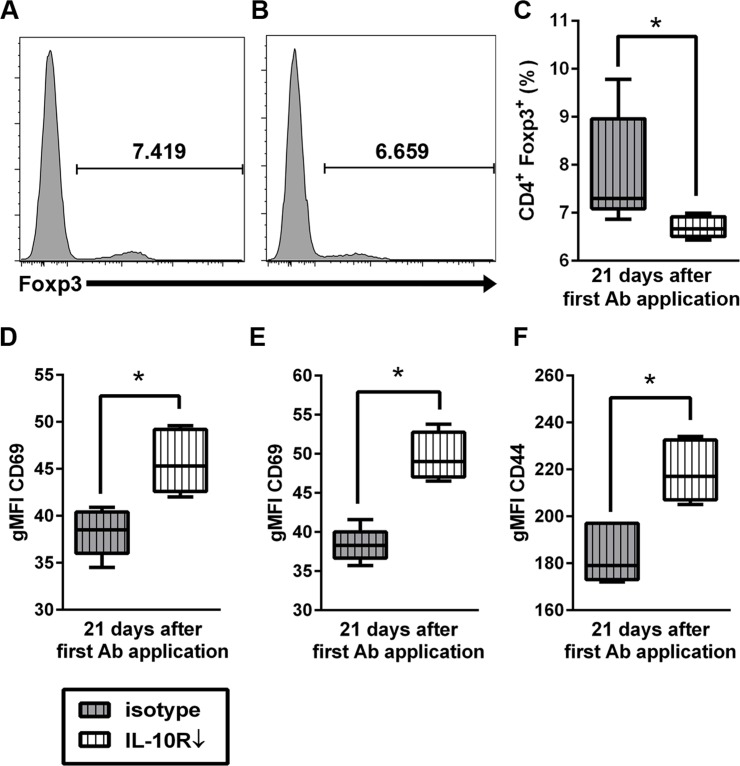
Fig 12. Effects of interleukin-10 receptor (IL-10R) blockade upon splenocytes of non-infected SJL mice.
Histograms show higher relative numbers of CD4+Foxp3+ regulatory T cells in (A) control animals (group “isotype”) compared to (B) animals receiving anti-IL-10R antibody (IL-10R Ab; group “IL-10R↓”). For gating strategy see S3 Fig. (C) Relative decrease of splenic CD4+ Foxp3+ Treg in IL-10R blocked mice at day 21. Simultaneously, gMFI of CD69 gated on CD4+ cells (D) and CD8+ cells (E) were increased at day 21. (F) Similarly, an increased gMFI of CD44 gated on CD8+ cells was detected at day 21. grey box with vertical lines = control animals (group “isotype”), white box with vertical lines = IL-10R blocked animals (group “IL-10R↓”). Box and whisker plot display median, minimum and maximum values as well as upper and lower quartiles, 5 animals used in both groups, Wilcoxon rank-sum tests, * = p < 0.05.

