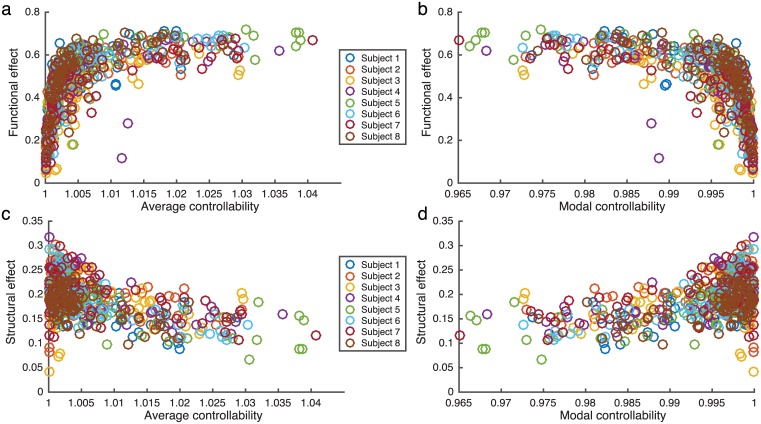
Fig 5. Functional effect of stimulation.
(a-b) The functional effect of regional stimulation plotted as a function of the average (a) and modal (b) controllability for each of the 83 brain regions. (c-d) The structural effect of regional stimulation plotted as a function of the average (c) and modal (d) controllability for each of the 83 brain regions. Controllability predictions, simulations, and calculation of the functional and structural effects were performed for each of the three scans for each subject and the data points reflect values averaged over scans.

