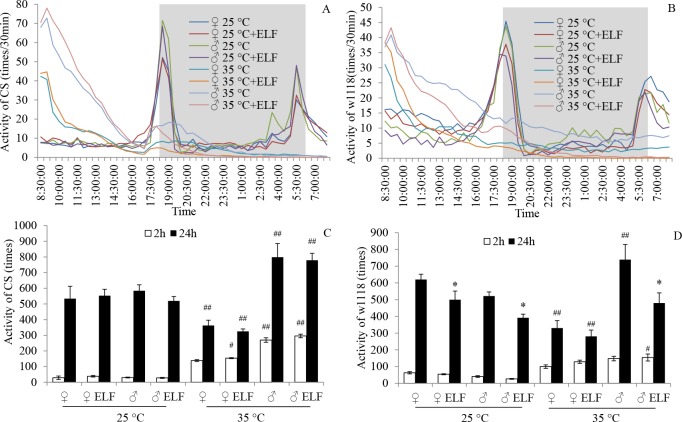
Fig 2. ELF-EMF and thermal stress effects on fly locomotion.
Activity frequencies of flies were counted every 30 min from the beginning of stress. (A) CS locomotion rhythm in the first 24 h. (B) w1118 locomotion rhythm in the first 24 h. White and gray backgrounds in the charts represent day and night, respectively. (C) CS activity frequencies in the first 2 and 24 h. (D) w1118 activity frequencies in the first 2 and 24 h. Data are presented as mean ± SEM. Hash (#) indicates significant difference between groups 25°C and 35°C when other factors are the same (# P < 0.05, ##P < 0.01). Asterisk (*) indicates significant difference between ELF-EMF and non-ELF-EMF exposure groups when other factors are the same (* P < 0.05).

