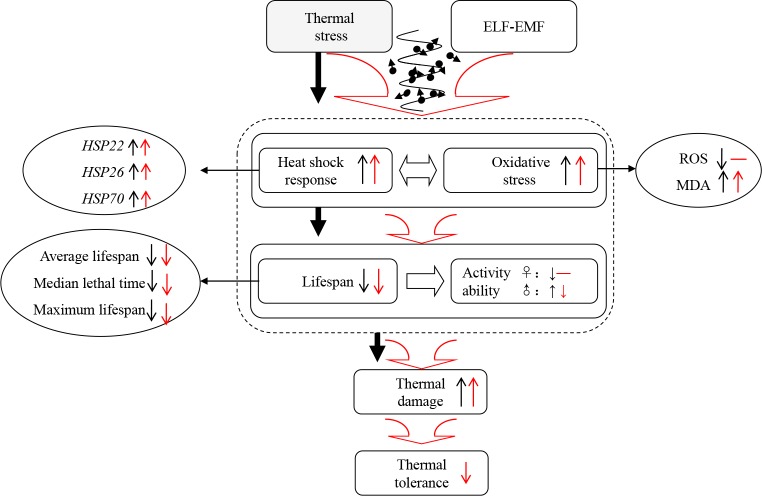
Fig 5. A concise summary of the study.
Black arrows indicate the observations in the groups exposed to 35°C compared with those subjected to 25°C thermal stress. Red arrows correspond to the results of the groups exposed to 35°C + ELF compared with those subjected to 35°C thermal stress. Upward arrows represent an increasing trend of the corresponding factor, whereas downward arrows show a decreasing trend of the corresponding factor.

