
Fig 2. Categorisation of environments based on phenotypic variance.
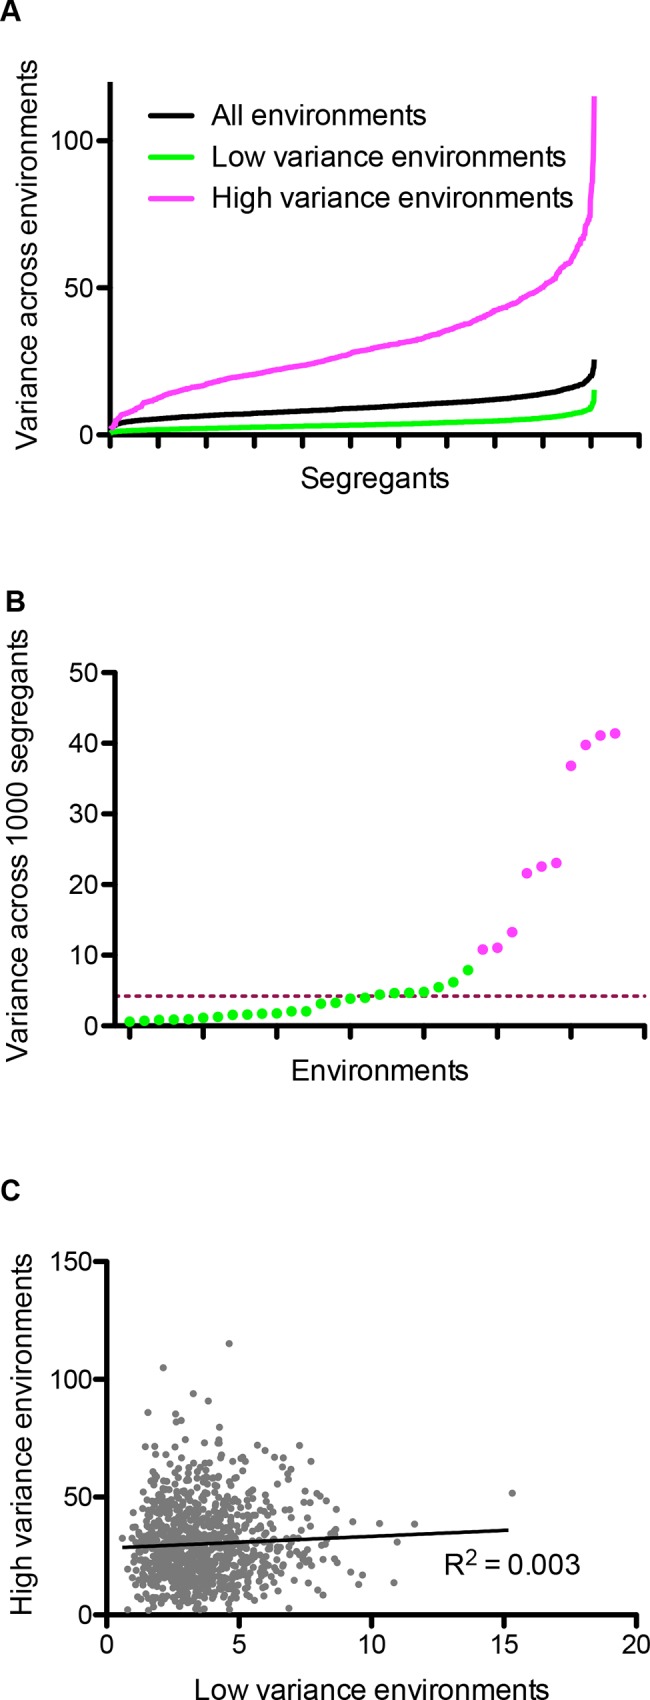
(A) Phenotypic variance of ~1,000 segregants (x-axis) across different environments (y-axis). (B) Phenotypic variance of ~1,000 segregants (y-axis) within each environment (x-axis). Green colour refers to environments with low phenotypic variance (Lv) and pink refers to environments with high phenotypic variance (Hv). The dashed line indicates the median of the distribution. (C) Comparison of phenotypic variance of ~1000 segregants between Hv (y-axis) and Lv (x-axis) environments. A low regression coefficient indicates poor correlation between the two.