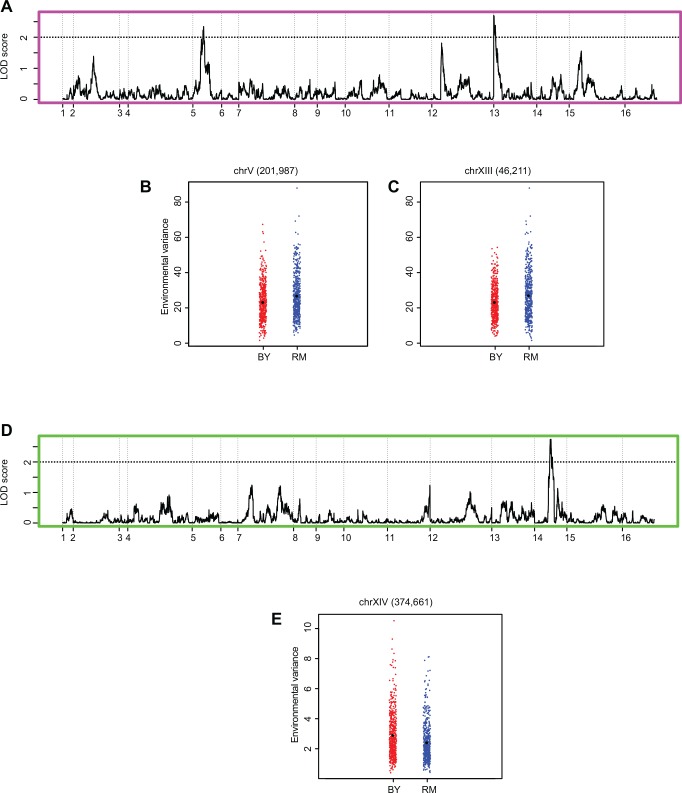
Fig 3. QTL mapping of environmental variance in Hv and Lv environments.
(A) LOD score distribution plot of environmental variance across Hv environments. The dashed line represent the LOD cut off of 2.0, permutation P < 0.01. (B) Dot plot of marker at chrV (201,987). (C) Dot plot of marker at chrXIII (46,211). (D) LOD score distribution plot of environmental variance across Lv environments. The dashed line represent the LOD cut off of 2.0, permutation P < 0.01. (E) Dot plot of marker at chrXIV (374,661). Red and blue colours denote BY and RM alleles respectively.

