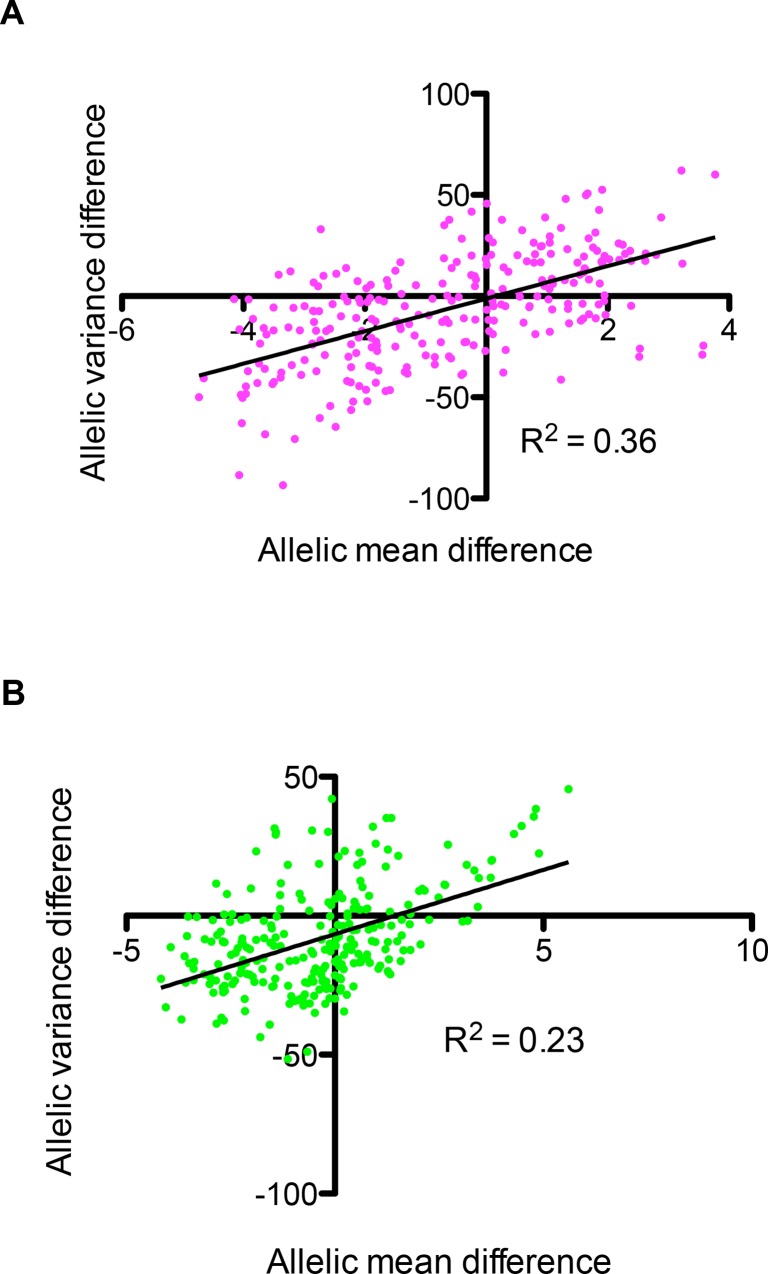
Fig 6. Comparison of mean and variance of allelic reaction norms.
Comparison of difference in mean and variance of the alleles of peaks identified in 10 different random orders in Hv (A) and Lv (B) environments. x-axis shows the difference between mean value of sum of slopes of alleles for different peaks, BY-RM, and y-axis refers to difference between variance of sum of slopes of alleles, BY-RM. See S3 Table for more details.

