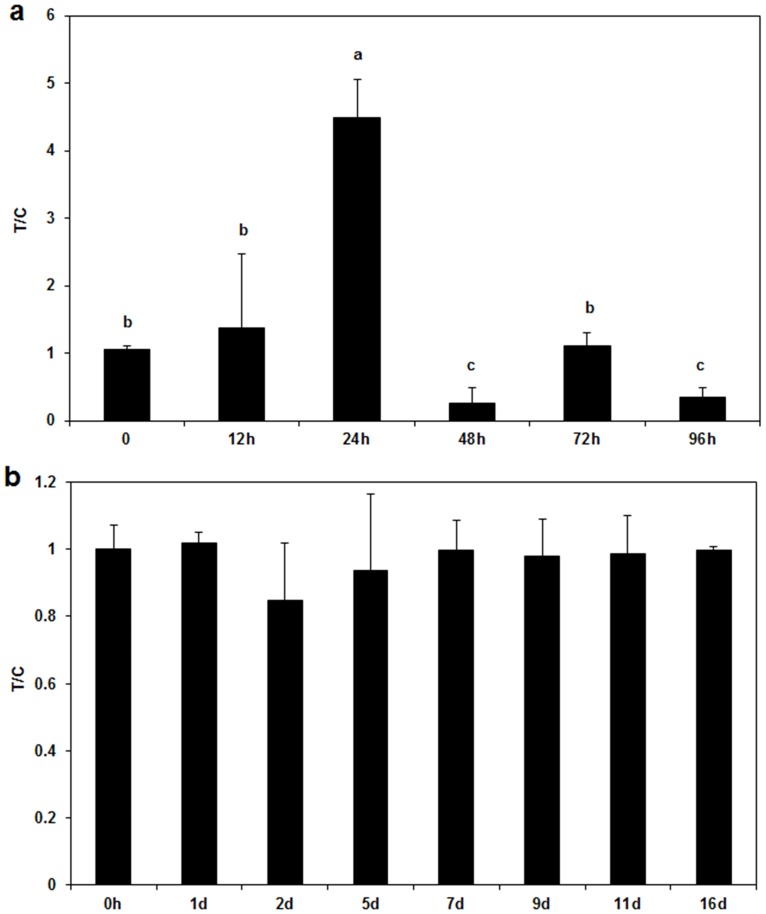
Fig 3. Quantification of Valsa mali in asymptomatic and symptomatic apple bark samples.
Effects of application of Hhs.015 fermentation broth on V. mali in asymptomatic (a) and symptomatic apple bark samples (b) were assessed using the developed RT-qPCR method. T/C is a ratio of the colonization coefficient value of the treatment group over that of the control group. Bars represent the standard deviations. Each sample was amplified in three replicates. Statistical analysis was carried out using One-Way ANOVA. Different letters above the error bar (a) denote significant differences at p<0.05 for time factor.

