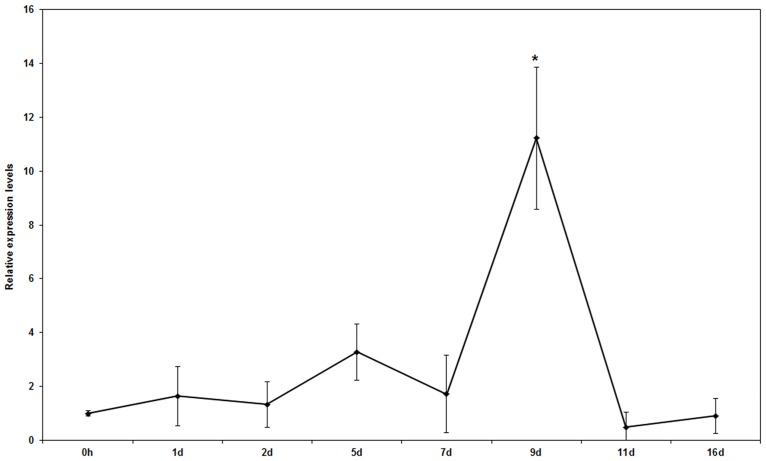
Fig 5. Effects of Saccharothrix yanglingensis Hhs.015 fermentation broth on EPG gene expression.
Gene expression was assessed as described (M&M). Bars represent the standard deviations. Each sample was amplified three times. Statistical significance of the differences between means was evaluated using One-Way ANOVA. * denotes significant differences at p<0.05 for time factor.

