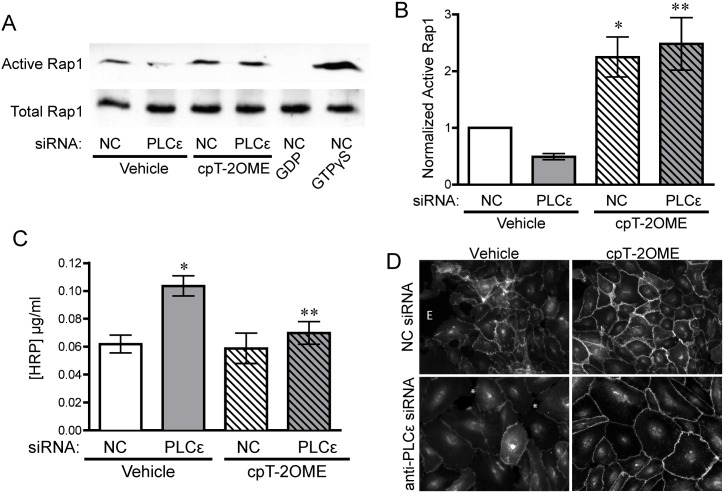
Fig 3. PLCε depletion leads to decreased basal Rap1 activity, which drives monolayer leak.
A) Active Rap1 pulldown assay from lysates infected with negative control (NC) or PLCε siRNA ± 1μM 8-pCPT-2′-O-Me-cAMP-AM (cPT-2OMe), 1mM GDP, or 100μM GTPγS. Blots are representative, n = 7. B) Densitometric quantification of blots in (A). Data shown are active Rap1 normalized to total Rap1 ± SEM, n = 7, p = 0.0001 by ANOVA, *p<0.05 vs. NC infected cells by post-hoc test, and **p<0.05 vs. PLCε siRNA infected cells. All blots used for quantification can be found in S6 Fig. C) HRP leak through HPAEC monolayer infected with NC or PLCε siRNA ± 1μM 8-pCPT-2′-O-Me-cAMP-AM. Data shown are the mean HRP concentration, ± SEM. N = 5, p = 0.0022 by ANOVA, *p<0.001 by post-hoc test vs. NC infected cells and **p<0.05 vs. PLCε siRNA infected cells. D) VE-cadherin stained HPAEC infected with negative control or PLCε siRNA ±1μM 8-pCPT-2′-O-Me-cAMP-AM (cPT-2Ome). * indicates gaps occurring between endothelial cells. E- edge of monolayer. Images are representative of 3 separate experiments.

