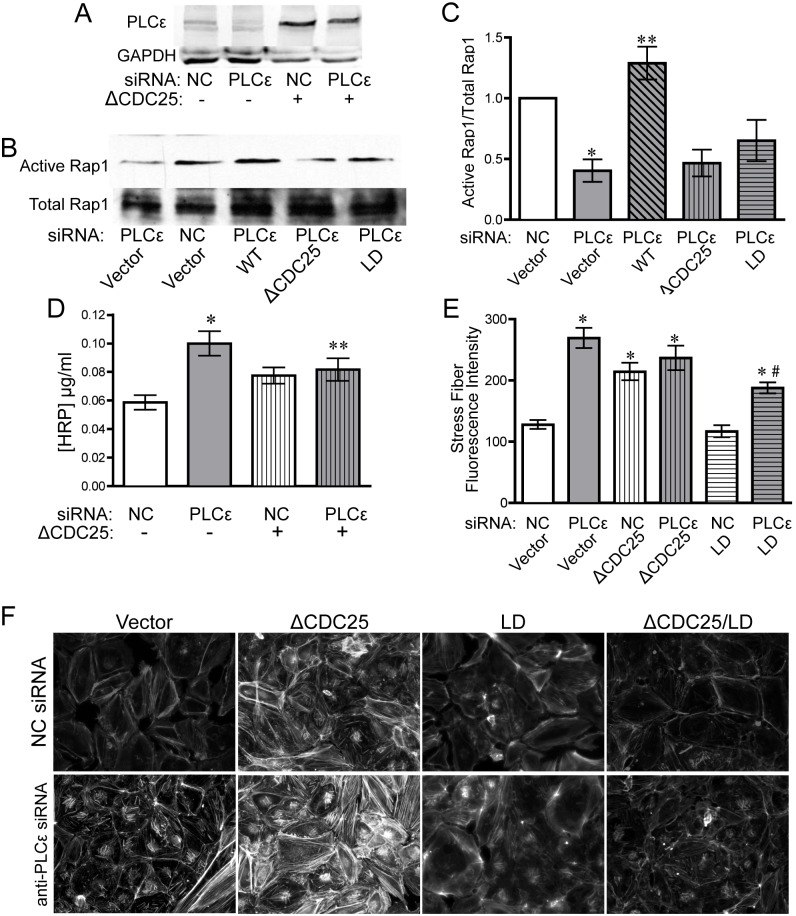
Fig 4. The CDC25 domain of PLCε maintains monolayer integrity and basal Rap1 activity.
A) PLCε expression in HPAEC infected with NC or PLCε siRNA ± PLCε ΔCDC25. Blots are representative, n = 4. B) Active Rap1 pulldown assay from lysates infected with negative control or PLCε siRNA ± siRNA resistant PLCε (WT), PLCε ΔCDC25, or PLCε lipase dead (LD). Blots are representative, n = 5. C) Densitometric quantification of blots in (B). Data shown are active Rap1 normalized to total Rap1 ± SEM, n = 5, p = 0.0001 by ANOVA, *p<0.01 vs. NC infected cells by post-hoc test, and **p<0.001 vs. PLCε siRNA infected cells. All blots used for quantification can be found in S7 Fig. D) HRP leak through HPAEC monolayer infected with negative control (NC) or PLCε siRNA ± PLCε ΔCDC25 (ΔCDC25). Data shown are the mean HRP concentration, ± SEM. n = 17, p<0.0001 by ANOVA, *p<0.001 by post-hoc test vs. NC infected cells and **p<0.05 vs. NC infected cells. E) Fluorescent intensity quantification of actin staining in (F). n≥40 cells from 10 fields of view, p<0.0001 by ANOVA, *p<0.001 by post-hoc test vs. NC infected cells. #p<0.001 vs. PLCε siRNA infected cells. F) Epifluorescence images of rhodamine-phalloidin stained HPAEC infected with negative control or PLCε siRNA ± ΔCDC25, LD, or ΔCDC25/LD. Images are representative of 3 separate experiments.

