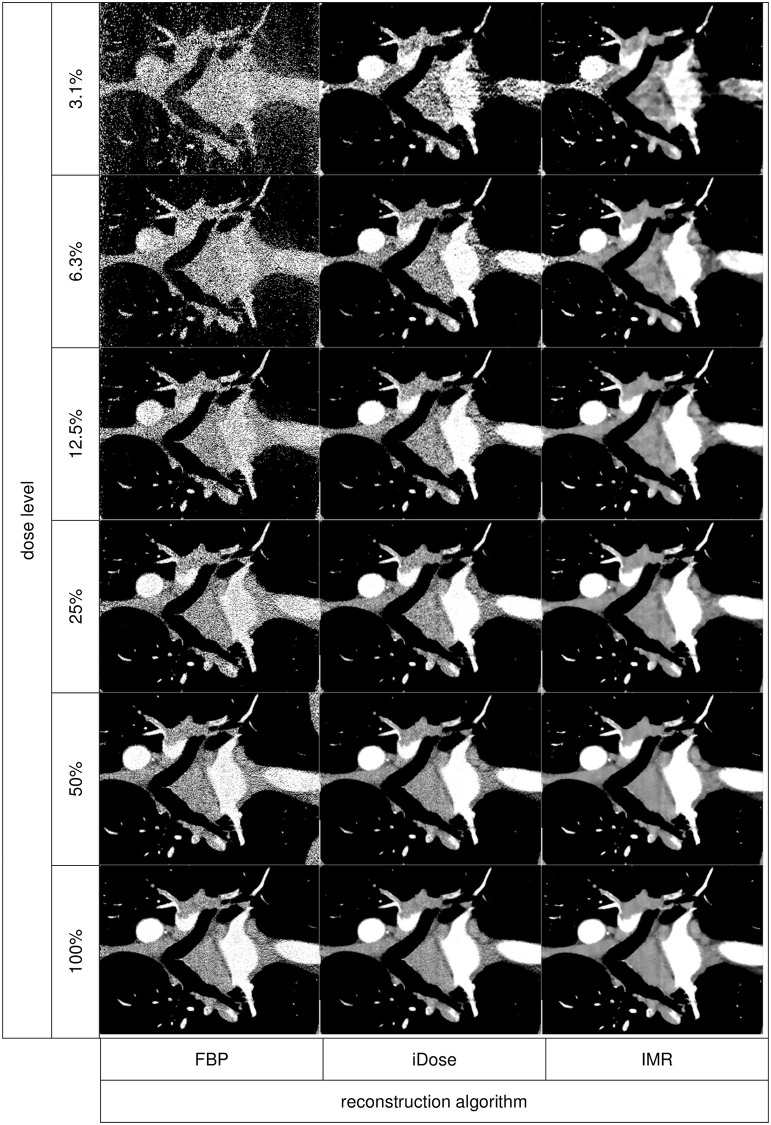
Fig 4. Comparison of FBP, iDose and IMR at dose levels of 3.1–100%.
Enlarged view of the coronal tomographic slices of the chest from Fig 3, indicated by the red dashed rectangle. Comparison of FBP (top), iDose (middle) and IMR (bottom) at different dose levels (from left to right: 100%–50%–25%–12.5%–6.3%–3.1%). Emboli are located in the right pulmonary artery, the left upper and lower lobar artery and in several segmental arteries of the left lung. Note the good detectability even at ultra-low dose levels with IMR. With iDose emboli are also detectable but image quality is inferior to IMR. With FBP, emboli are not certainly detectable at lower dose levels. FBP = filtered back projection, iDose = iterative dose reduction, IMR = iterative model reconstruction.

