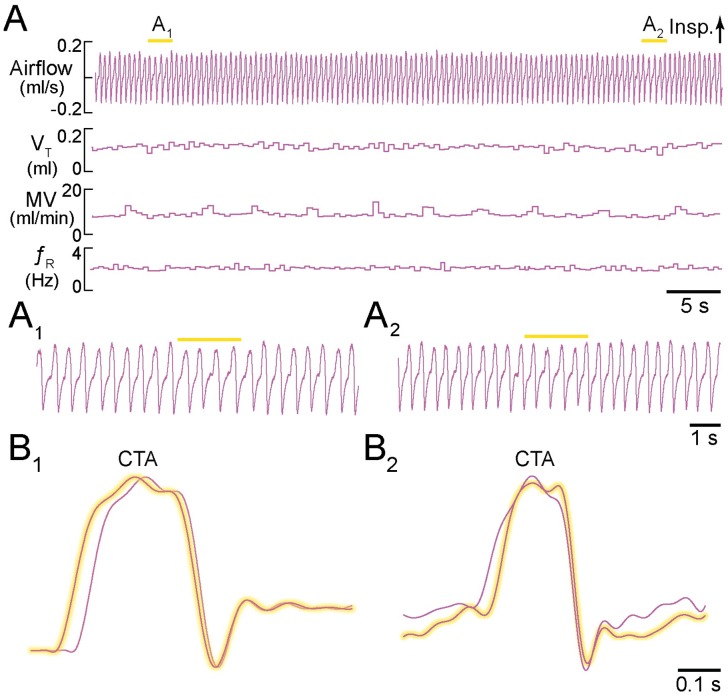
Fig 4. Light application to the dorsal medulla rostral to preBötC in sedated mice.
A, Airflow, VT, MV, and fR plotted continuously during two consecutive applications of 2-s light pulses. Inspiratory airflow is plotted upward, which reflects nose-cone measurements. A1, A2, Expanded airflow traces from A. Yellow bars indicate 589-nm light application. B1, B2, Cycle-triggered averages of airflow from each bout prior to (not highlighted) and during illumination (highlighted). Time calibrations are shown for each panel.

