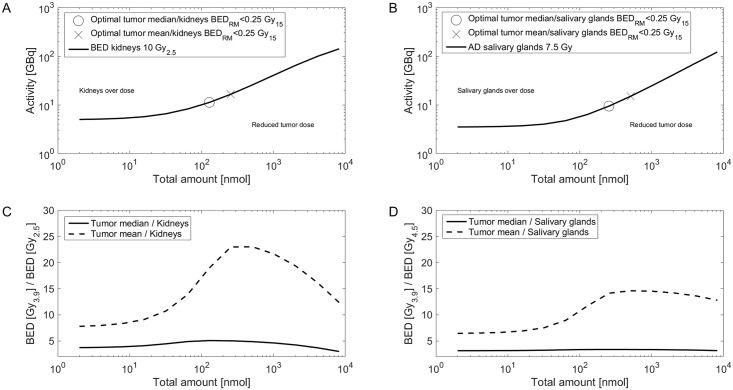
Fig 3. Optimal BED ratios.
In panel A and B, the activity and peptide amount combinations that lead to a kidney BED of 10 Gy2.5 (A) or a salivary absorbed dose of 7.5 Gy (B) for red marrow BED < 0.25 Gy15 are depicted for the median patient. All combinations along the kidney 10 Gy2.5 line (C) or salivary glands 7.5 Gy (D) are used to calculate the tumor BEDs for mean and median tumor parameters. The optimal combinations for a maximal tumor-to-kidney or tumor-to-salivary gland BED ratio were added to panel A and B, respectively. The simulations of each single patient are shown in S2.

