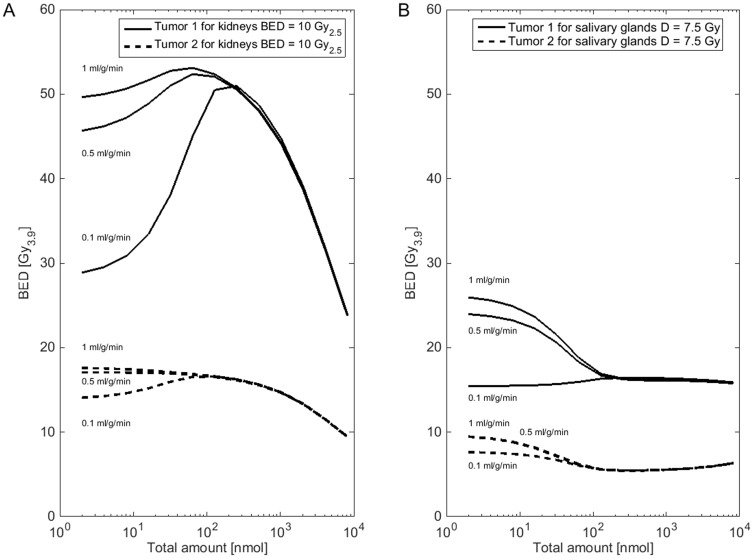
Fig 4. Blood flow sensitivity analysis.
In panel A and B, the tumor BED for activity and peptide amount combinations (2−213 nmol and red marrow BED < 0.25 Gy15) that lead to a kidney BED of 10 Gy2.5 (A) or salivary gland BED of 7.5 Gy (B) is shown for different assumptions for the perfusion rate. The estimated parameters of patient 2 (bone tumor 1, lymph node tumor 2) were used. The results of all patients can be found in S3 File.

