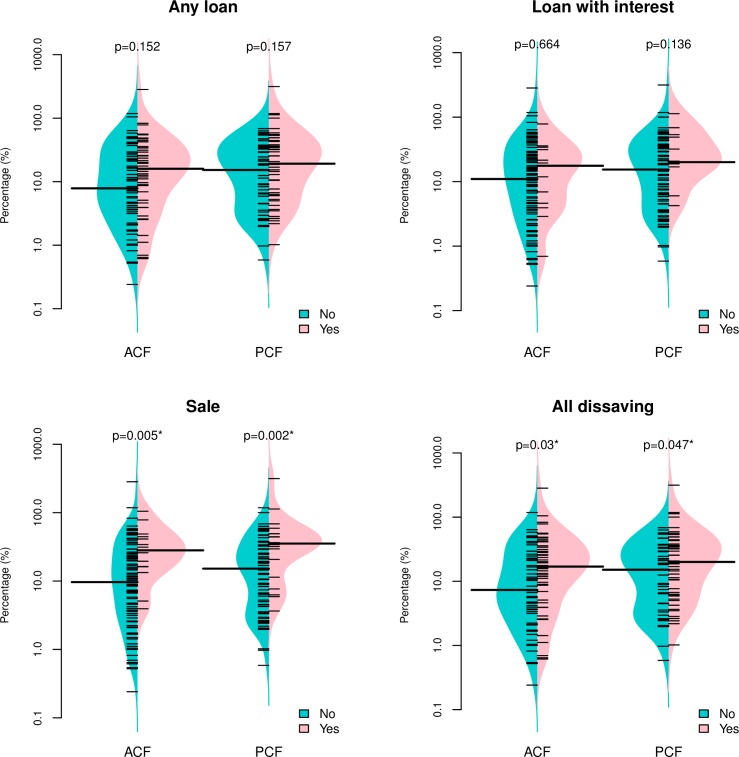
Fig 5. Cost as percentage of annual household income, by dissaving patterns and case finding approach.
A short bar indicates an observed value of household’s cost-income levels. A long bar indicates the median. Shaded areas show the density of the distribution. P-values were calculated using a Wilcoxon rank-sum test. A log scale was used for the y-axes.

