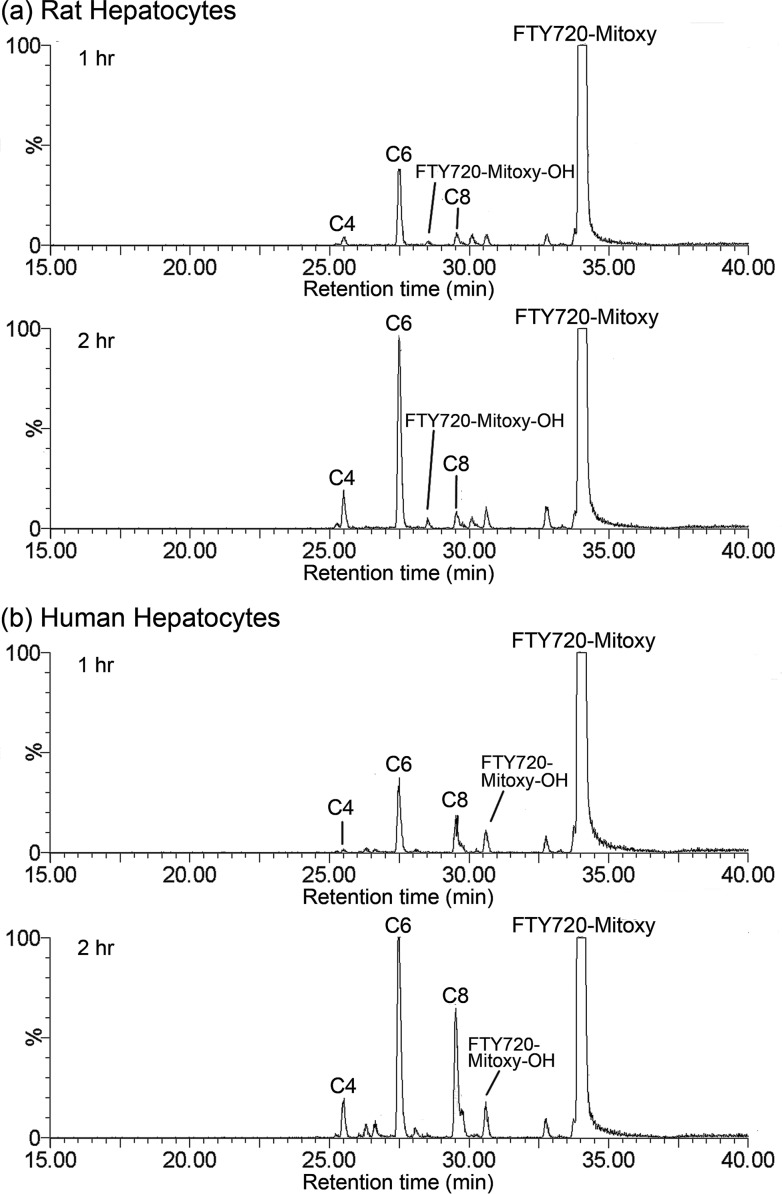
Fig 3. Representative LC/MRM Chromatogram of FTY720-Mitoxy Metabolite Profile.
Using 1 μM of FTY720-Mitoxy, we incubated rat (a) and human (b) hepatocytes to obtain metabolite profiles. To simplify presentation, the 0 min incubation time point data are intentionally not shown. Legend: C4, FTY720-Mitoxy C4-carboxylic acid; C6, FTY720-Mitoxy C6-carboxylic acid; C8, FTY720-Mitoxy C8-carboxylic acid; FTY720-Mitoxy-OH, hydroxy FTY720-Mitoxy.

