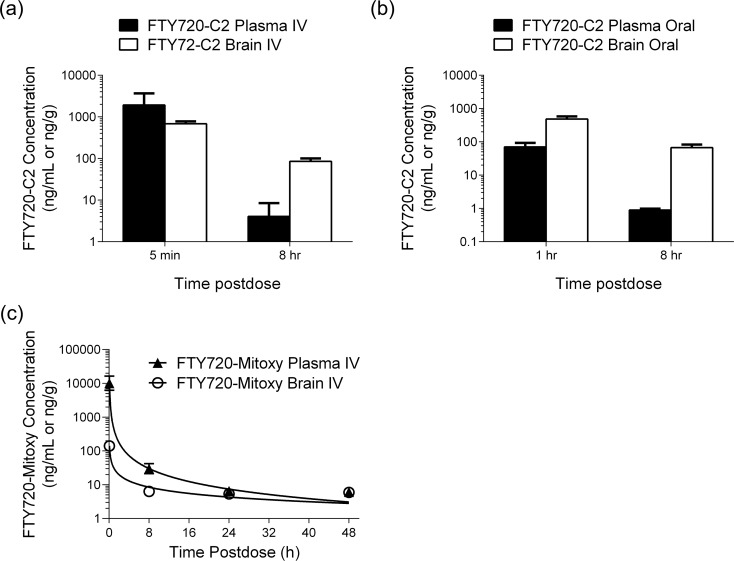
Fig 5. Plasma and Brain FTY720-C2 and FTY720-Mitoxy concentration profiles.
Mean plasma and brain concentrations of FTY720-C2 after IV dosing (a) and oral dosing (b) (black bar = plasma; white bar = brain); and of FTY720-Mitoxy after IV dosing (c) (▲ = plasma; ○ = brain). Units are in ng/mL for plasma and ng/g for brain. Data represent the mean ± SD of two experiments for each time point. Error bars were calculated for all samples and are present on the graphs. However, for samples with little variability error bars do not extend beyond the edges of the symbols so thus, are not apparent.

