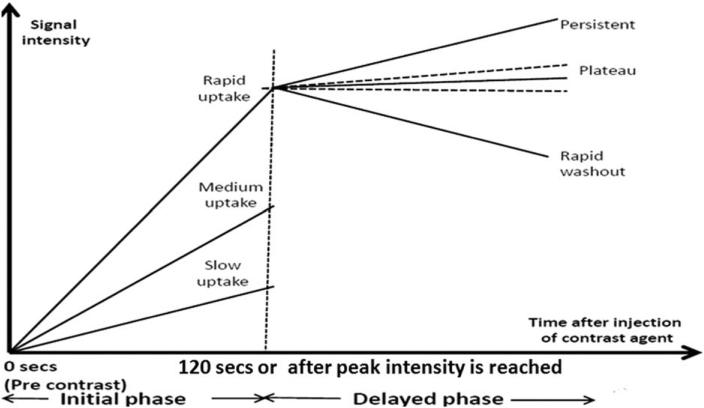
FIGURE 1.
Signal intensity time/kinetic curve for a particular voxel. This curve shows the contrast enhancement pattern of a tumor voxel in T1 MRI, fat-suppressed images following injection of gadolinium. Initial enhancement (IE) and postinitial enhancement (PIE) kinetic maps are generated by quantifying the initial and the delayed phase for each pixel within the tumor, respectively.

