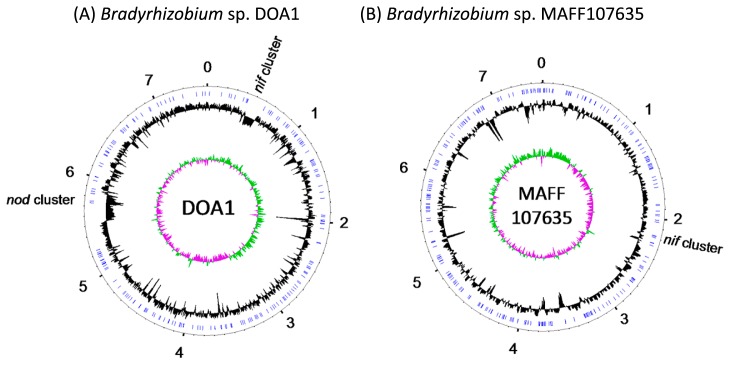
Fig. 2.
Circular view of whole-genome sequences of Bradyrhizobium sp. DOA1 (A) and MAFF107635 (B) chromosomes. The outermost circle represents genome positions in megabases. The second-outermost circle illustrates the positions of gap regions (blue). The innermost and second-innermost circles illustrate the GC (guanine-cytosine) skew (green and purple) and GC content (black), respectively.

