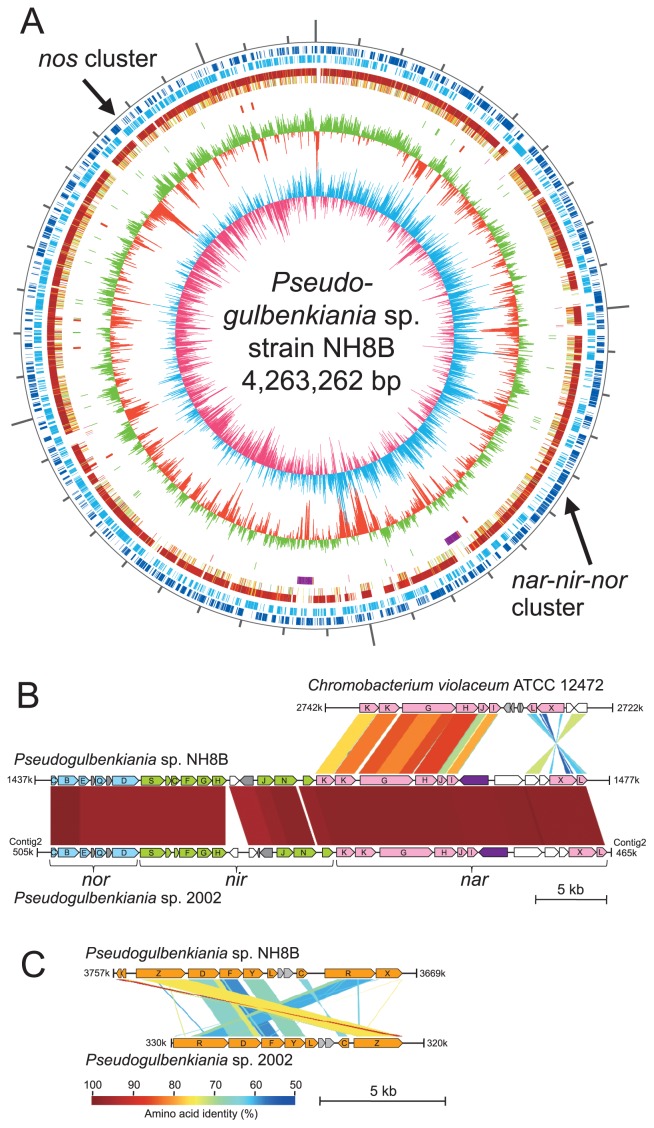
Fig. 2.
Comparison of genomes of Pseudogulbenkiania sp. strain NH8B, strain 2002, and Chromobacterium violaceum ATCC 12472. (A) Circular representation of the Pseudogulbenkiania sp. NH8B genome. From the outside in: circles 1 and 2 of the chromosome show the positions of protein-coding sequences on the positive and negative strands, respectively. Circles 3 and 4 show the positions of protein-coding sequences that have orthologs in Pseudogulbenkiania sp. 2002 and Chromobacterium violaceum ATCC 12472, respectively. Circle 5 shows the positions of the prophages (purple) and integrative elements (pink). Circle 6 shows the positions of tRNA genes (green) and rRNA genes (red). Circle 7 shows a plot of the G + C content (higher values outward). Circle 8 shows a plot of the GC skew ([G − C]/[G + C]; light blue indicates values > 0; red indicates values < 0). (B) Schematic diagram of nitrate reductase (Nar), nitrite reductase (Nir), and nitric oxide reductase (Nor) gene clusters from strain NH8B, strain 2002, and C. violaceum ATCC 12472. (C) Schematic diagram of the nitrous oxide reductase (Nos) gene cluster from strain NH8B and strain 2002.

