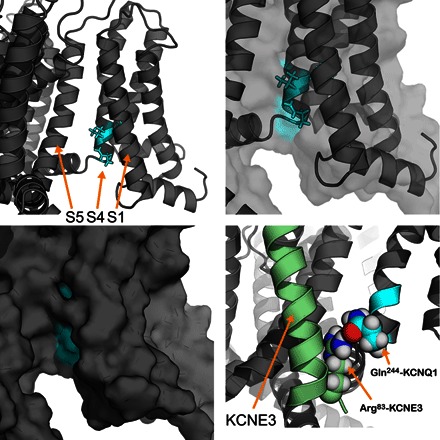
Fig. 10. Location of key KCNQ1 functional determinants of KCNE3 modulation.

The integrative models of the KCNE3-KCNQ1 complex are useful to visualize the S4 functional determinants of KCNE3 modulation in KCNQ1. The upper left panel highlights His240, Val241, and Gln244 in cyan that are key to KCNE3 modulation. The upper right panel shows the same residues, zoomed in, with both a cartoon and transparent surface representation of the same region of KCNQ1. A surface representation (lower left) of these KCNQ1 residues (cyan) shows that these residues are surface-accessible in the KCNE3 binding cleft. The lower right panel shows the predicted hydrogen bond between KCNE3 Arg83 and KCNQ1 Gln244, which suggest a potential mechanism for the distinct KCNE3 modulation of KCNQ1 and KCNQ4.
