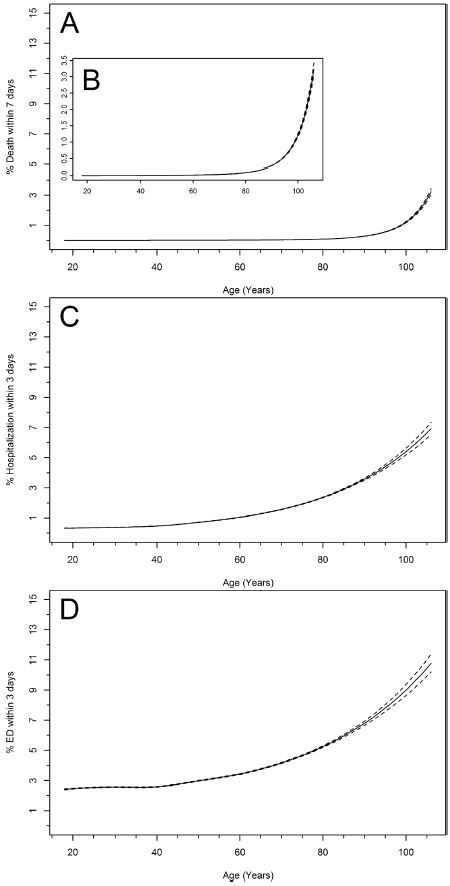
Figure 2.

Age-specific risk curves for morbidity and mortality subsequent to an urgent care (UC) visit. Part A shows mortality within 7 days of an UC visit, magnified in part B. Part C shows percent hospitalization within 3 days and part D shows percent emergency department visits within 3 days of an UC visit. The solid line represents point estimates and the dotted lines are 95% confidence intervals.
