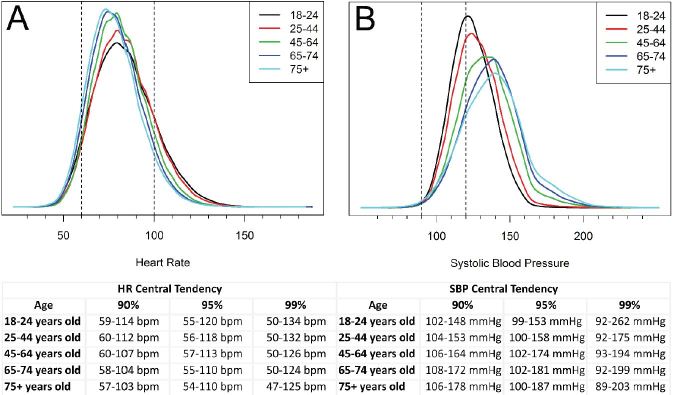
Figure 3.
Distributions of observed values of heart rate (HR) (A) and systolic blood pressure (SBP) (B) for different age groups. Generally accepted “normal” ranges are indicated by vertical dashed lines.12–15 The tables below the graphs show the 90th, 95th and 99th percentiles by age group. Aggregate HR data fit within the “normal” range approximately 82% of the time for HR, but only about 31% for SBP.
bpm, beats per minute; mmHg, millimeters of mercury

