
Figure 7. In vitro and ex vivo intermolecular transposition mediated by bbRAG1L/2L.
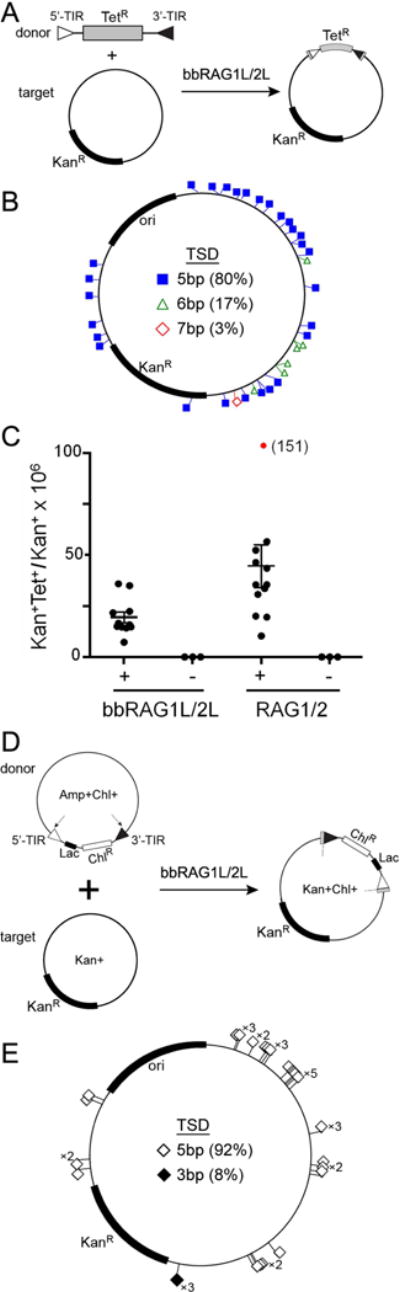
(A) Schematic diagram of the assay used to detect in vitro transposition mediated by purified bbRAG1L and bbRAG2L proteins.
(B) The distribution of in vitro transposition target sites in the recipient plasmid.
(C) Quantitation of in vitro transposition efficiency of bbRAG1L/2L and mouse RAG1/2. Each dot represents the results of an independent reaction with the horizontal bar indicating the mean (+/− SEM). For RAG1/2, one data point (red) was outside of the range of the y-axis and its value is indicated in parentheses. Means for bbRAG1L/2L and RAG1/2 were 19.4 and 44.6, respectively.
(D) Schematic diagram of the assay used to detect in vivo transposition mediated by bbRAG1L and bbRAG2L in 293T cells.
(E) The distribution of in vivo transposition target sites in the recipient plasmid.
See also Figure S6.