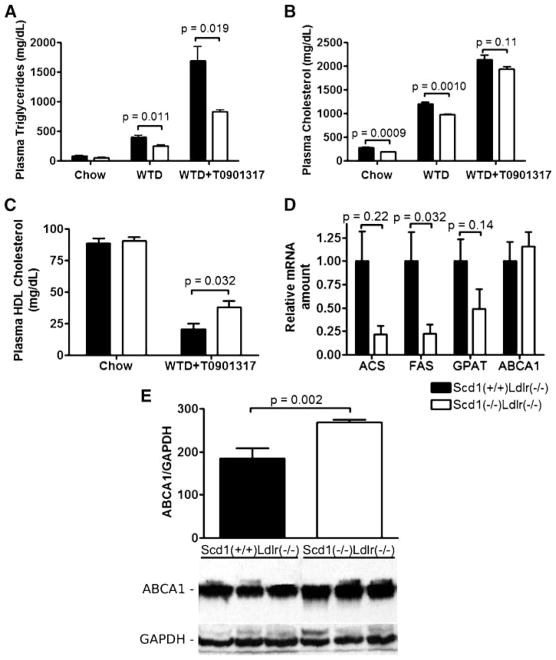
Fig. 8.
Plasma lipid response to LXR agonist treatment in Ldlr−/− mice lacking SCD1. A, B: Plasma TG (A) and TC (B) contents of Scd1+/+Ldlr−/− and Scd1−/−Ldlr−/− mice 10–12 months of age at baseline and after being fed a Western diet (WTD) for 9 days and a Western diet plus 10 mg/kg T0901317 for 3 additional days. C: Plasma HDL-cholesterol at baseline and after T0901317 feeding. n = 7–8 mice per group. D: Relative amount of mRNA encoding acetyl-CoA synthetase (ACS), FAS, glycerol-3-phosphate acyltransferase (GPAT), and ABCA1 in liver after T0901317 feeding. Each value represents the amount of mRNA relative to that in Scd1+/+Ldlr−/− mice (arbitrarily set at 1 for each transcript in these mice). n = 4–5 mice per group. E: Quantification and representative immunoblot of liver lysates from Scd1+/+Ldlr−/− and Scd1−/−Ldlr−/− mice with antibodies against ABCA1, with GAPDH as a loading control. n = 5–8 mice per group. Data shown are means ± SEM.

