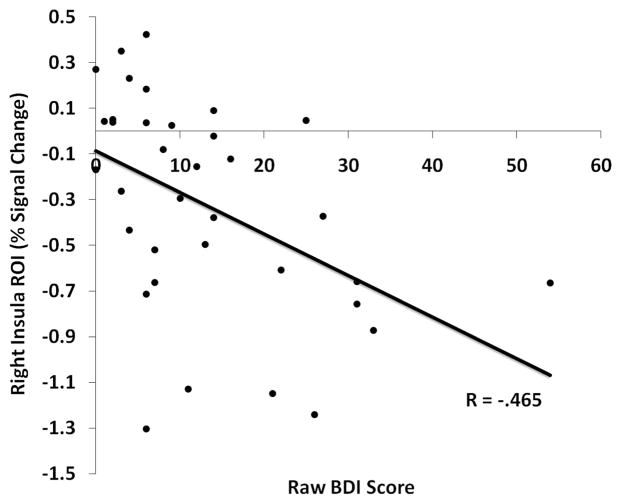
Figure 3.
Correlation plot between the right insula percentage signal change from all participants (control and mindfulness training [MT]) and their raw Beck Depression Inventory (BDI) scores. Greater BDI-II scores at time of functional MRI scan predict greater reductions of activity in the right insula region of interest (ROI).

