
Figure 7.
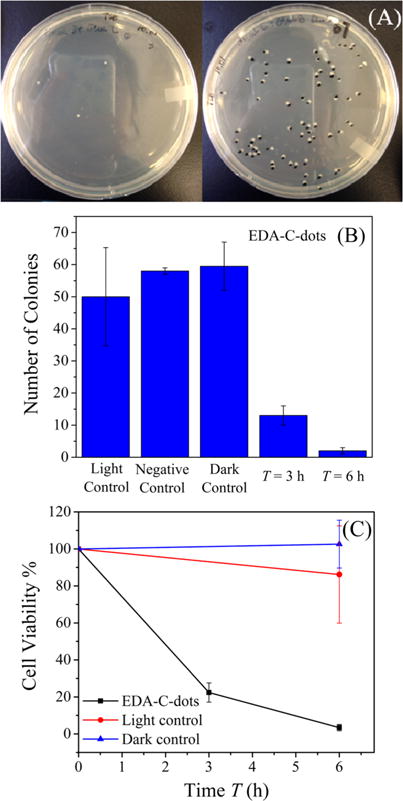
Photoinduced bacteria inactivation by the EDA carbon dots: (A) photographs showing colonies on TSA plates (left, 6 h treatment; right, dark control); (B) E. coli colony numbers; (C) cell viability ratio. The carbon dots were presented in the dark control.