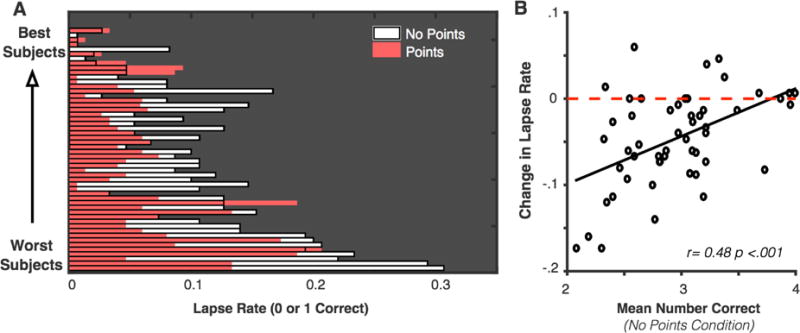
Figure 4. Change in lapse rate for individual subjects in Experiment 3.

(a) Proportion of lapses (x-axis) is shown for individual subjects. Subjects are sorted on the y-axis by their overall performance in the no-feedback condition. White bars and black outlines depict the proportion of lapses in the no-feedback condition, and shaded bars represent proportion of lapses in the feedback condition. Thus, if lapse rate is reduced in the feedback condition, the corresponding bar appears white on the right-hand side. If lapse rate is not reduced, then the corresponding bar is entirely shaded. Subjects in both the top and bottom of the overall performance distribution show a large reduction of lapses in the feedback condition relative to baseline lapse rates. (b) The change in lapse rate across conditions is correlated with overall task performance, likely because high-performing subjects have lapse rates near floor in both conditions.
