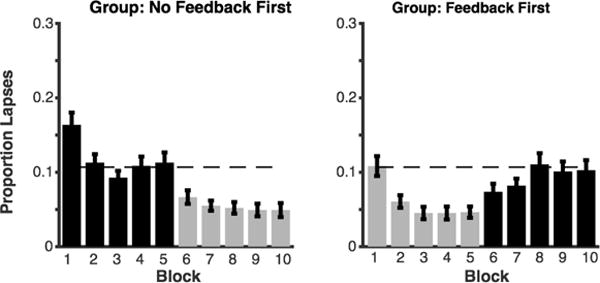
Figure 5. Proportion of lapse trials (0 or 1 correct) over each block of Experiment 3.

Black bars represent blocks in the no-feedback condition; gray bars represent blocks in the feedback condition. The left panel shows the group of subjects who received no feedback first; the right panel shows the group of subjects who received feedback first. The dotted line shows the average lapse rate for blocks 2–5 during the no-feedback condition in the left panel.
