Figure 1.

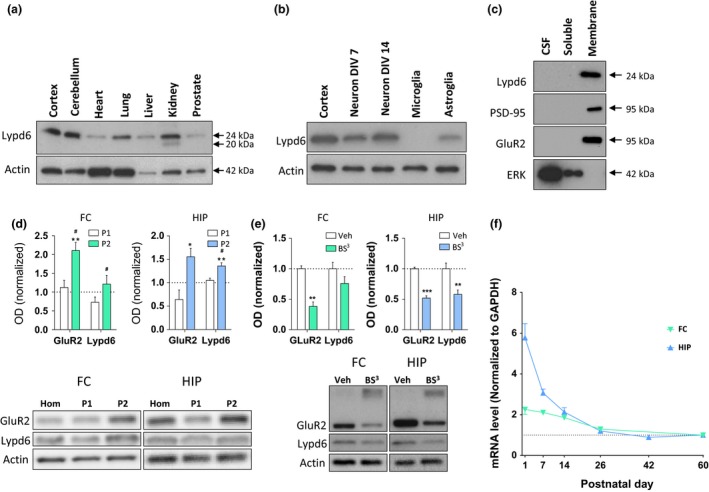
Distribution and developmental expression of Lypd6. (a–e) Representative images and analysis of western blots showing Lypd6 protein levels in: (a) different organs of adult male rats (n = 2) in relation to actin, (b) cortical tissue from adult male rats, rat cortical primary neurons cultured for 7 or 14 days in vitro (neuron DIV7 and 14, respectively), rat primary microglia cultured for 15 days in vitro, and rat primary astroglia cultured for 18 days in vitro (n = 3) in relation to actin, (c) cerebrospinal fluid (CSF), and soluble and membrane fractions of cortical tissue from adult male rats. The membrane‐bound proteins, PSD‐95 and GluR2, and the soluble protein extracellular signal‐regulated kinase 1 (ERK) are used as controls for effective fractionation (n = 4), (d) FC and HIP tissue fractionated using differential centrifugation into a pellet 1 (P1, nuclear) and pellet 2 (P2, crude synaptosome) fraction. Data are normalized to actin levels and the level of the non‐fractionated homogenate (Hom) was set to 1 (dashed line). *p < 0.05, **p < 0.01 indicates statistical difference between non‐fractionated homogenate and the P2 fraction, # p < 0.05 indicates statistical difference between the P1 and P2 fractions in a Bonferroni‐corrected ratio paired t‐test (n = 5), (e) minced tissue extracts from the FC or HIP of adult male rats cross‐linked with bis(sulfosuccinimidyl) suberate (BS 3) or vehicle (Veh). The staining for GluR2 shows that cross‐linking with BS 3 reduces the intensity of the GluR2 band at 95 kDa, and produces a smear of high‐molecular weight cross‐linked proteins. Data are normalized to actin levels and the vehicle group was set to 1. **p < 0.01, ***p < 0.001 indicates statistical difference between vehicle‐ and BS 3‐treated tissue in a Bonferroni‐corrected ratio paired t‐test (n = 9–11). (f) Lypd6 mRNA levels in frontal cortex (FC) and hippocampus (HIP) from male rats killed at post‐natal day 1, 7, 14, 26, 42, or 60 (n = 5–6). The values were normalized to GAPDH levels.
