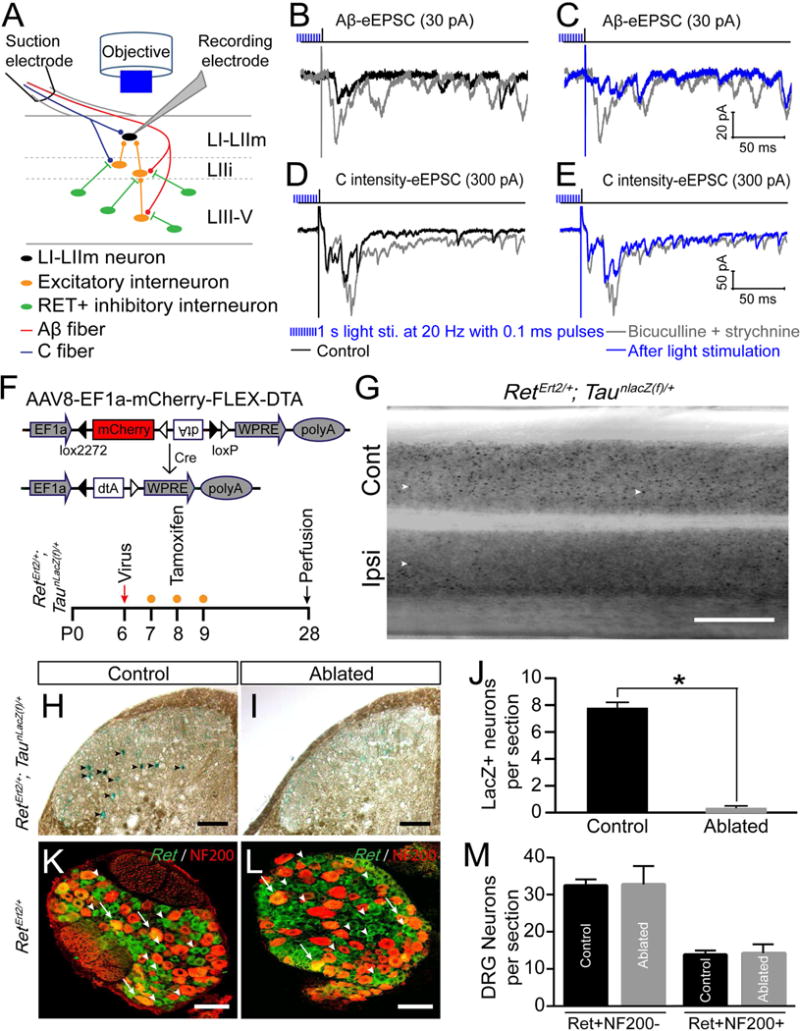
Figure 6. Activation of early RET+ dDH neurons blocks hyperactivity of A and C pathways and specific ablation of early RET+ dDH neurons.

(A) Schematic showing polysynaptic EPSC recording from DH layer I–II neurons of 3–4pw RetErt2/+; AAV8-Flex-ChR2 mice upon pharmacological dis-inhibition. Primary afferents were activated by electrical dorsal root stimulation using Aβ or C intensities, while light stimulation (1 second light at 20 Hz with 0.1 ms pulses) was applied to activate early RET+ dDH neurons. (B) Representative traces of Aβ-eEPSCs recorded from a layer IIi neuron by 25pA dorsal root stimulation. Upon 10 μM biuculline and/or 0.4 μM strychnine perfusion, Aβ-eEPSCs dramatically increased, especially the polysynaptic components. (C) This increase of Aβ-eEPSCs upon dis-inhibition was significantly blocked by light stimulation. (D) Representative traces of a layer IIm neuron upon 300 pA dorsal root stimulation. This neuron received both monosynaptic Aβ and C inputs in normal condition. Upon pharmacologic dis-inhibition, C intensity triggered polysynaptic components increased. (E) This increase of C intensity triggered eEPSCs was greatly blocked by light stimulation. (F) Schematic showing DNA structure of AAV8-Flex-DTA and the timeline of intraspinal virus injection, tamoxifen treatment, and analysis. (G) Dorsal view of whole mount lumbar spinal cord LacZ staining from an AAV8-Flex-DTA injected 4pw RetErt2/+; TaunLacZ mouse. Examples of LacZ+ neurons are indicated by white arrowheads. Cont, Contralateral side; Ipsi, ipsilateral side. Scale bar, 0.5 mm. (H–I) LacZ staining of ipsilateral lumbar dorsal spinal cord sections of control 2 and DTA Abl mice. LacZ+ neurons are indicated by black arrowheads. Scale bars, 100 μm. (J) Quantification of LacZ+ neurons in control (7.8 ± 0.5/section) and DTA Abl (0.3 ± 0.1/section) mice. 8–10 horizontal sections per mouse were counted around the L4 injection site. N=4 mice per group, p < 0.05, student’s unpaired t test. Data are represented as mean ± SEM. (K–L) Representative images of fluorescent in situ hybridization of Ret and immunostaining of NF200 with ipsilateral L4/L5 DRG sections of control (K) and DTA Abl mice (L). Scale bars, 50 μm. (M) Quantification of RET+/NF200+ and RET+/NF200− L4 DRG neurons in control and DTA Abl mice. p > 0.05, student’s unpaired t test. 4–5 sections/mouse and n=3 mice/group.
