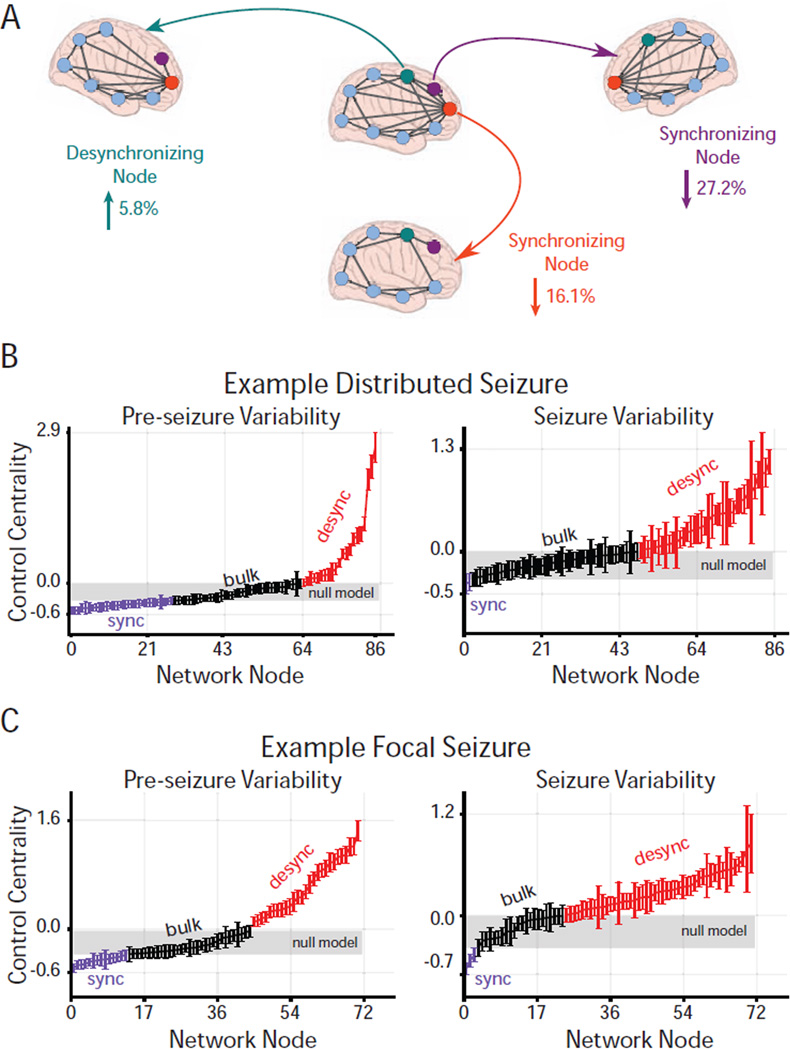
Figure 3. Virtual Cortical Resection Localizes Network Controllers.
(A) Effect of node removal on network synchronizability (control centrality) in a toy network. Highlighted node removals resulting in increased synchronizability (desynchronizing node; green) or decreased synchronizability (synchronizing nodes; purple and orange). The strongest desynchronizing node increased synchronizability by 5.8% and was present in the network periphery, while the strongest synchronizing nodes decreased synchronizability by 27.2% and 16.1% and were located in the network core. The magnitude and direction of change upon removing a node is called its control centrality. (B) Virtual cortical resection applied to example distributed ((C) and focal) high-γ epileptic network event in a pre-seizure (left) and associated seizure (right) epoch yields a time-varying control centrality for each node. Network nodes are ordered by increasing mean control centrality during the epoch. We assigned each node as a desynchronizing, synchronizing, or bulk controller type using a null distribution of control centrality, constructed by randomly permuting functional connection strength 100 times for each network time window and applying virtual cortical resection to every node from every rewiring permutation. Nodes with mean control centrality in the upper or lower-tail of the null distribution (p < 0.05) were assigned as desynchronizing (red) or synchronizing (purple) nodes, respectively, otherwise, nodes with mean control centrality within the null distribution (range highlighted in gray) were assigned to the bulk (black). Error bars represent standard error of control centrality computed over time windows during the pre-seizure or seizure epoch.

