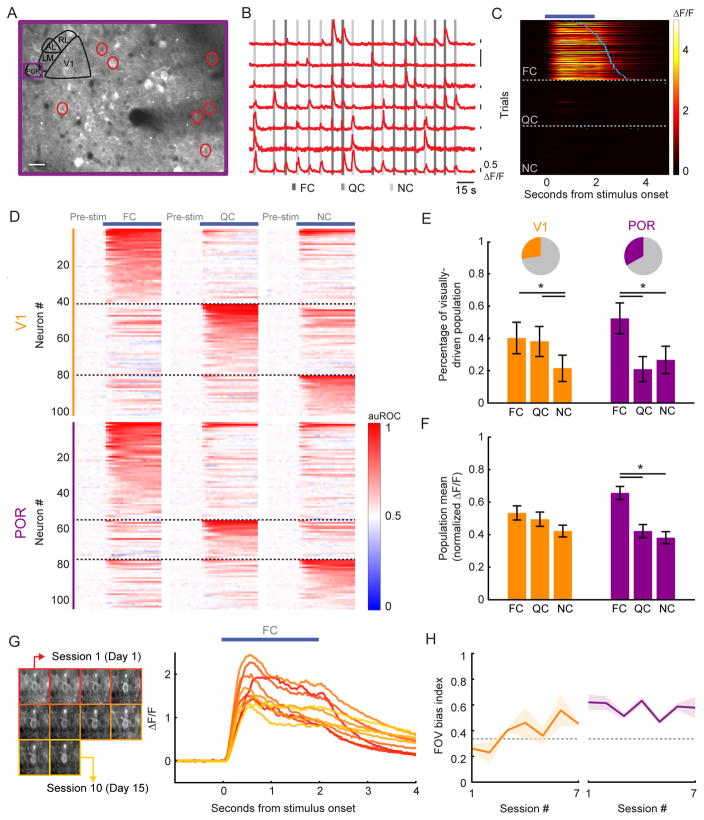
Figure 2. POR, but not V1, demonstrates a response bias to food-associated cues in food-restricted mice.
A. Example two-photon image of GCaMP6f expression in POR. Depth: 130 μm.
B. ΔF/F traces from example neurons circled in A. A 50% change in fluorescence (0.5 ΔF/F) is denoted via each black vertical line. Many neurons were responsive to specific visual cues (shaded gray vertical lines).
C. Heatmap of single trial cue-evoked response timecourses (ΔF/F) from an example POR neuron, sorted by visual cue and by latency to first lick (blue ticks). Dark blue bar denotes duration of cue presentation.
D. Normalized auROC timecourses (auROC: area under the receiver operating characteristic) for all significantly driven neurons recorded in V1 and POR. Neurons were sorted according to their preferred cue.
E. Of all recorded cells, 27% in V1 and 33% in POR had a significant cue-evoked response (pie charts). Of these responsive neurons, a significant proportion preferred the FC vs. the QC in POR, but not in V1. Errorbars: 95% confidence intervals.
F. By normalizing cellular tuning curves to the largest response and averaging across all responsive neurons, we observed a bias in the mean population response to the FC in POR, but not in V1. Errorbars: SEM across cells.
G. Stable mean food cue-evoked timecourses (right) for one example neuron that was recorded in 10 imaging sessions over 15 days (left).
H. During each imaging session for each well-trained mouse, we calculated a FC bias index (dashed line at 0.33: no bias towards the food cue) across the field-of-view (FOV). We observed a strong bias towards the FC that was stable across daily sessions in populations of neurons recorded in POR (right) but not in V1 (left). Errorbars: SEM across animals. *p<0.001, 2-way ANOVA; FC: food cue; QC: quinine cue; NC: neutral cue. Tests on proportions: Tukey’s HSD. See also Figures S2–S4.

