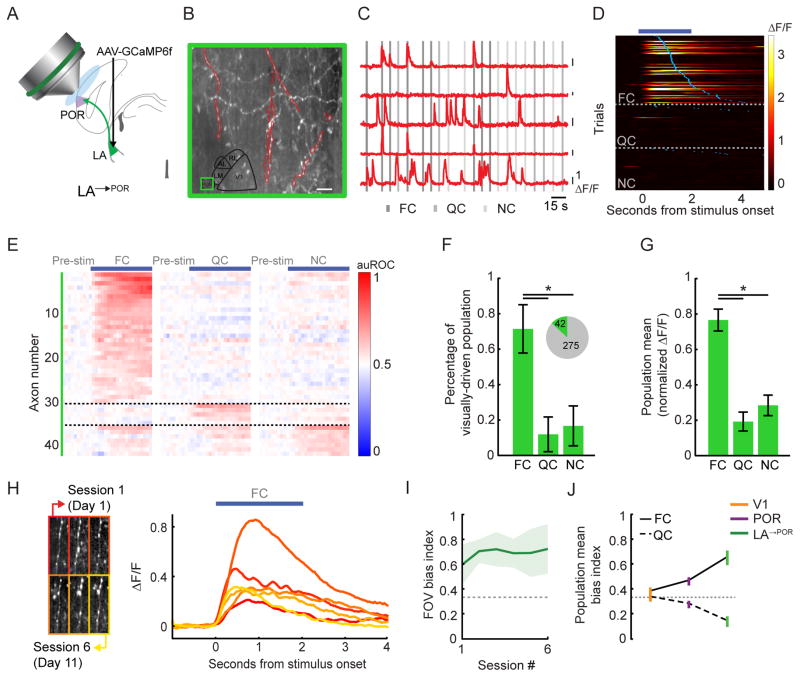
Figure 4. LA feedback axons in POR demonstrate a strong response bias to food-associated cues in food-restricted mice.
A. Schematic demonstrating in vivo two-photon calcium imaging of LA axons in POR (LA→POR).
B. Example two-photon image in POR, with a subset of LA→POR axons outlined in red.
C. ΔF/F traces from those LA→POR axons outlined in B. A 100% change in fluorescence (ΔF/F) is denoted via each black vertical line.
D. Heatmap of single trial cue-evoked response timecourses (ΔF/F) from an example FC-responsive LA→POR axon, sorted by visual cue and by latency to first lick (blue ticks). Dark blue bar denotes duration of cue presentation.
E. Normalized auROC timecourses for all significantly driven LA→POR axons. Each neuron’s responses to all three cues are shown. Neurons are sorted by their preferred cue. Note the high proportion of FC-preferring neurons.
F. We observed a significant visual cue-evoked response in 13% of all recorded LA→POR axons (pie charts). Most axons preferred the FC vs. the NC or QC. Errorbars: 95% confidence intervals.
G. By normalizing cellular tuning curves to the largest response and averaging across all responsive LA→POR axons, we observed a strong bias towards the food cue. Errorbars: SEM across cells.
H. Stable mean FC-evoked timecourses (right) for one example axon, recorded across 6 imaging sessions (left).
I. During each imaging session for each well-trained mouse, we calculated a FC bias index (dashed line at 0.33: no bias towards the food cue) across the field-of-view (FOV). We observed a reliable population bias towards the FC in LA→POR axons across sessions. Errorbars: SEM across animals.
J. Emergence of FC bias from V1 to POR to LA→POR. Errorbars: SEM across cells. * p<0.001, Kruskal-Wallis; FC: food cue; QC: quinine cue; NC: neutral cue. Tests on proportions: Tukey’s HSD. See also Figure S6.

