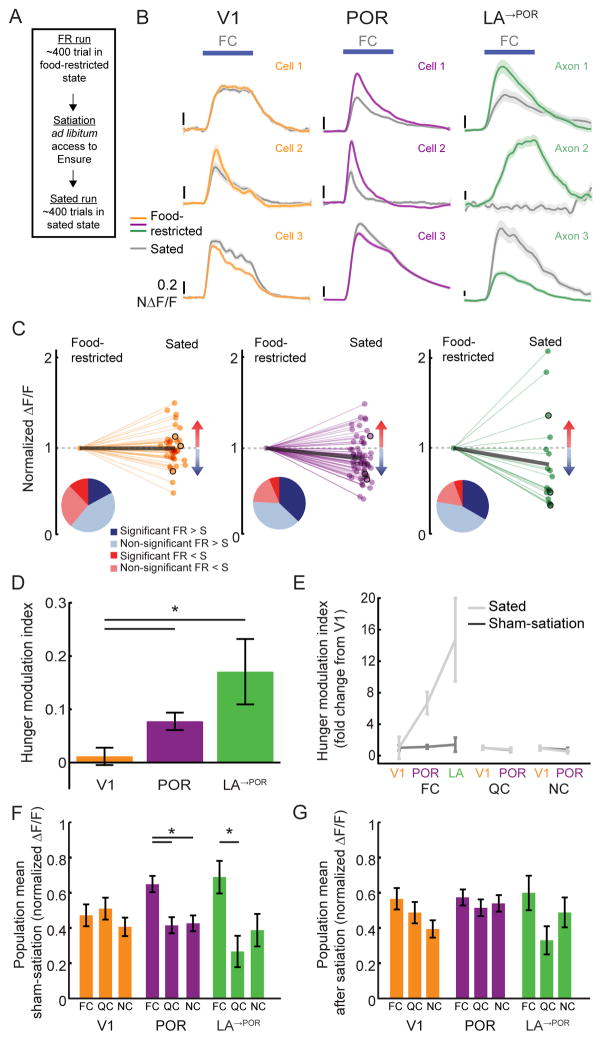
Figure 5. Food cue responses in POR and LA are modulated by hunger state.
A. After food-restricted (FR) mice performed ~400 trials of the Go/NoGo visual discrimination task, they were given free access to Ensure (while still head-fixed). Once mice were sated, they received ~400 additional trials (sated hit rate <25%; Figure S1B). In “sham-satiation” sessions, a similar ~45 minute period of time elapsed between early and late sets of trials, during which no Ensure was delivered (Figure S1A).
B. Example traces from V1, POR, and LA→POR neuron responses in FR (colored lines) and sated (gray lines) mice.
C. Normalized FC response magnitudes for those neurons that had a significant response to the FC and that were recorded in both FR and sated states. Values less than 1 indicate decreased responses when the mouse was sated. Pie charts illustrate proportions of neurons with responses that were increased (red), decreased (blue), significantly increased (dark red), or significantly decreased (dark blue) by satiation. Data from example neurons from (B) are outlined in black. Thick gray lines: population averages.
D. The average hunger modulation index of FC responses was significantly greater in POR and LA→POR neurons than in V1 neurons.
E. The increase in hunger-modulation index values in POR and LA→POR neurons (relative to the index value in V1 neurons) observed for the FC was not observed for the QC or NC, or for any cue in sham-satiation sessions.
F. The FC bias in the population mean response in POR and LA (Figures 2F, 4G) persists following the sham-satiation condition.
G. The FC bias was absent following satiation. Errorbars: SEM across cells. * p<0.05 2-way ANOVA; FC: food cue; QC: quinine cue; NC: neutral cue.

