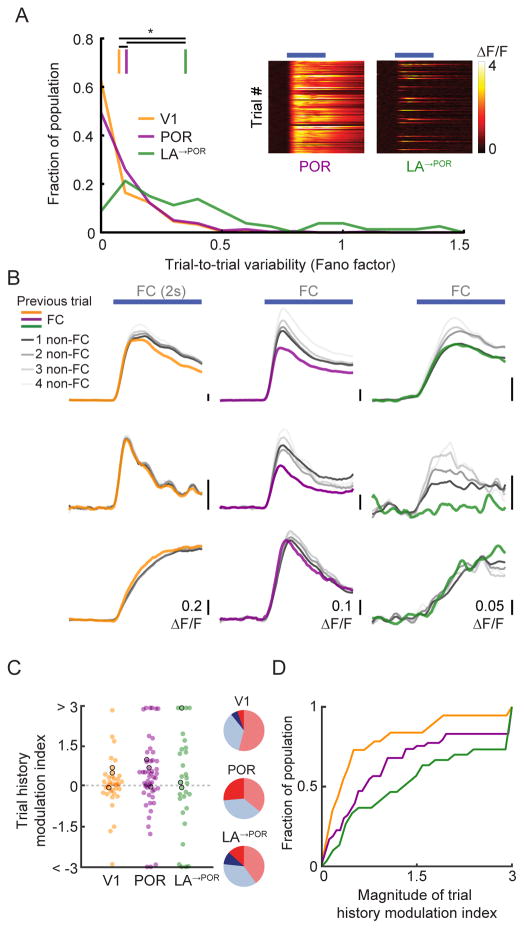
Figure 7. Trial history strongly modulates food cue responses in POR and LA.
A. Fano factor, a measure of trial-to-trial variability, increased from V1 to POR to LA→POR. Insets show single-trial food cue response timecourses from an example POR neuron (left) and LA→POR axon (right) in individual sessions.
B. Single-trial FC responses of V1, POR, and LA→POR neurons often depended on trial history. Colored lines represent responses to a FC when preceded by another FC, grayscale lines represent responses to the FC when preceded by one (dark) or many (lighter) non-FCs (QC or NC).
C. Neurons in all three areas showed modulation of FC responses based on trial history, with greater proportions exhibiting large trial history effects in POR and LA→POR vs. V1. A positive trial history modulation index value indicates greater FC response when preceded by a non-FC. Pie charts show fraction of neurons with positive (red), negative (blue), significantly positive (dark red) or significantly negative (dark blue) index values. Neurons outlined in black are example neurons from (B). For display purposes, all values >3 or <-3 were set to 3 and −3, respectively.
D. Cumulative distributions of the magnitude of index values, confirming that, as with hunger modulation, V1 neurons showed far less modulation by trial history than POR and LA→POR neurons (p=0.03, V1 vs. POR; p<0.001 V1 vs. LA→POR; Kruskal-Wallis).

