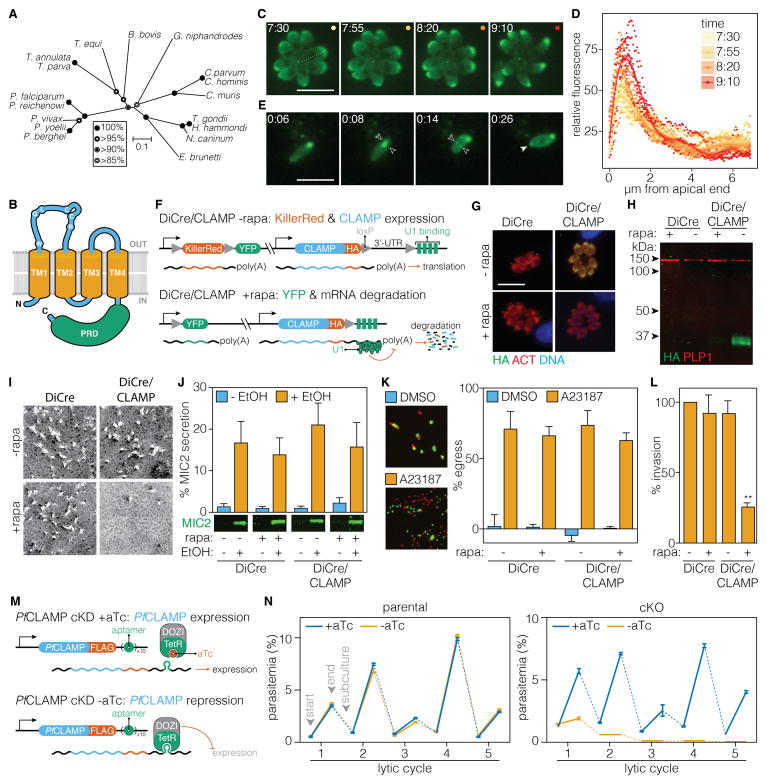
Figure 6. CLAMP Mediates T. gondii Invasion and is Essential for the P. falciparum Asexual Cycle.
(A) Neighbor-joining tree showing the phylogenetic relationships of CLAMP homologs in diverse apicomplexans. Bootstrap values for 10,000 trials are displayed. (B) Inferred topology of CLAMP highlighting transmembrane domains (orange) and the proline-rich domain (green). See also Figure S4.
(C–E) CLAMP-mNeonGreen localization during egress and invasion. Intracellular parasites expressing CLAMP-mNeonGreen were stimulated to egress with A23187 (C). Relative fluorescence across the length of each parasite (dotted line) is plotted for the four time-points shown. Lines are polynomial regressions ± 95% CI (D). The localization was also monitored during invasion (E). The position of the moving junction is indicated with paired open arrows. Solid arrowhead indicates a punctum of mNeonGreen at the posterior of the parasite appearing immediately after invasion. Time is expressed in min:sec following addition of the compound (C–D) or initiation of invasion (E). Scale bar = 10 μm.
(F) Diagram of the DiCre/CLAMP strain showing how after rapamycin (rapa) treatment the reporter locus switches from expressing KillerRed to expressing YFP, and CLAMP mRNA degradation is induced.
(G–H) A 2 hour treatment with rapa is sufficient to induce CLAMP degradation as demonstrated by immunofluorescence microscopy 24 hours later (G) or immunoblotting two days later (H). The parental strain (DiCre) is included as a control.
(I–L) The DiCre/CLAMP strain or its parental stain (DiCre) were treated as above. Parasites were harvested and phenotypically assayed for plaque formation (I), microneme secretion (J), egress (K) or invasion (L). Secretion was measured as the percent of total MIC2 present in the parasites (J). Egress was induced with A23187 and compared to a vehicle control (DMSO) over the same period (K). All results are means ± SEM for n = 3 independent experiments, ** p < 0.005 relative to the untreated DiCre strain.
(M) Diagram of the PfCLAMP cKD showing how removing aTc allows the TetR-DOZI regulator to bind and suppress expression.
(N) Growth curves of the parental strain (left) or the cKD (right) ± aTc. Means ± SD for n = 3 technical replicates. See also Figure S5D for an independent replicate.

