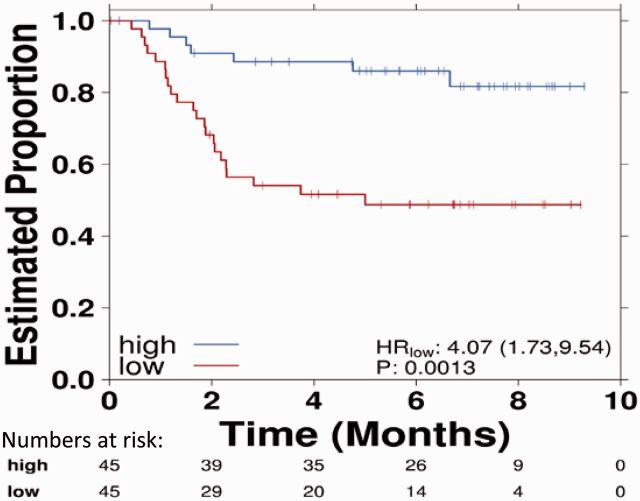
Figure 1.
Kaplan-Meier curves comparing survival data for two treatments with vertical tick marks representing censoring. Note that toward the tail of both curves censoring increases. The number of subjects in each group and at each time point is given numerically, as are the hazard ratio, confidence interval, and P value. CI = confidence interval; HR = hazard ratio.

