Figure 3.
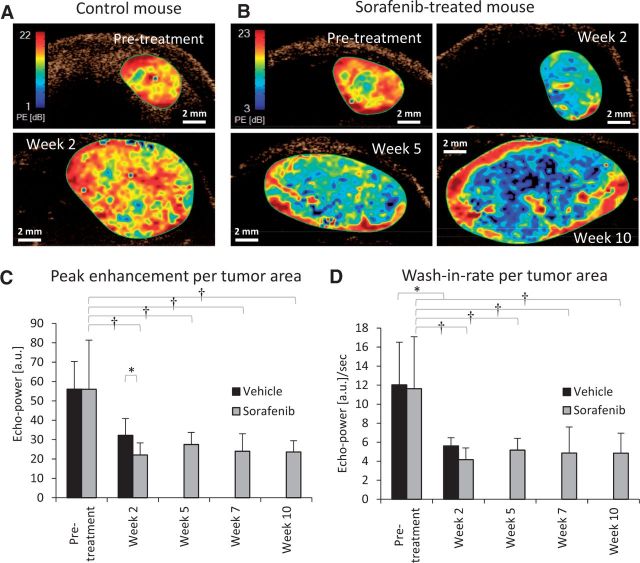
Global analysis of hepatocellular carcinoma (HCC) tumor perfusion during sorafenib treatment using contrast-enhanced ultrasound imaging. Representative parametric maps of peak enhancement (PE), an indicator of tissue blood volume, show changes in tumor perfusion in a (A) vehicle-treated and (B) sorafenib-treated mouse. Red represents regions of high PE, blue are areas of low PE, and black represents no perfusion. C) Average PE values decreased statistically significantly two weeks after sorafenib therapy (P < .001, †P < .001 vs pretreatment), but further changes were not statistically significant for the following weeks. No statistically significant changes occurred in vehicle-treated mice (P = .07) whereas a statistically significant change was observed between vehicle- and sorafenib-treated mice by week 2 (*P < .05). Vehicle control mice were sacrificed after week 2. D) Wash-in rate, used as an indicator of rate of blood flow, showed no statistically significant changes over time, including during periods of drug resistance. Statistically significant changes were only observed between pre- and post-treatment for both sorafenib (P < .001, †P < .001)- and vehicle (paired t test *P < .05)-treated groups. n = 4 (vehicle), n = 11 (sorafenib). Global perfusion changes were tested by repeated measures one-way analysis of variance. Error bars represent standard deviation.

