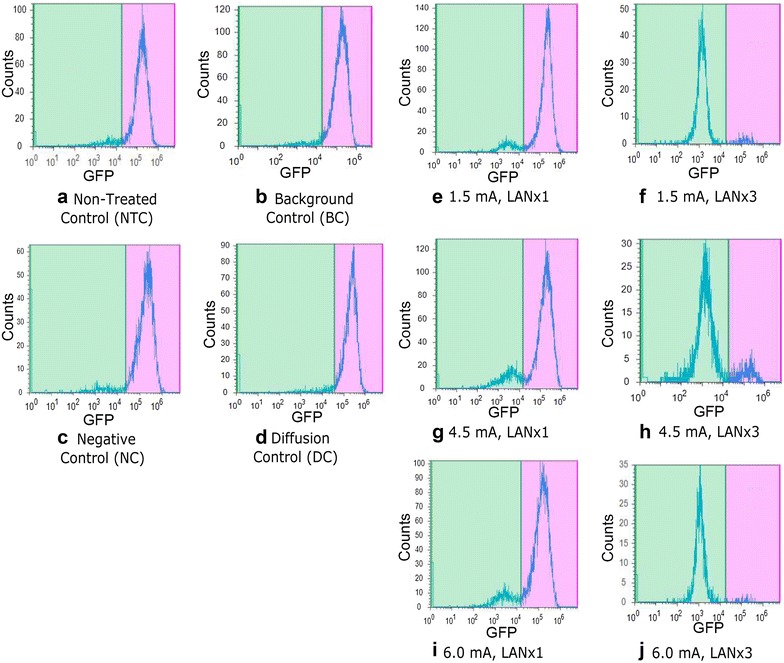
Fig. 3.

Flow cytometry analysis to determine gene expression changes. Histograms of raw data were divided to determine the number of GFP negative (left side) and GFP positive (right side) cells on the plot for each sample. The number of cells expressing GFP did not decrease in control samples (a–d). Side-by-side, experimental samples exhibited a significant increase in GFP negative cells when injected three times (LANx3) compared to cells injected once (LANx1) in 1.5 mA injections (e, f), 4.5 mA injections (g, h), and 6.0 mA injections (i, j). Compare to data in Table 1 and Fig. 4
