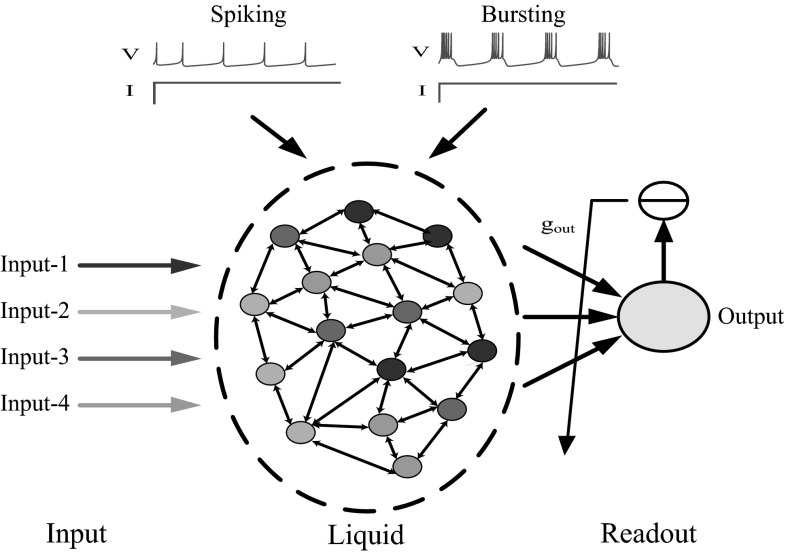
Fig. 1.
Schematic diagram of liquid computing. The Input-1, Input-2, Input-3 and Input-4 represent four input components. 400 neurons with spiking or bursting activity in LC are equally connected to four input streams independently. Neurons applied with different inputs are marked with different colors. Arrows in the liquid network represent the directions of synaptic connectivity. The readout neuron is connected to all of the neurons in the liquid with synaptic weights , which are trained by linear regression for different tasks. (Color figure online)

