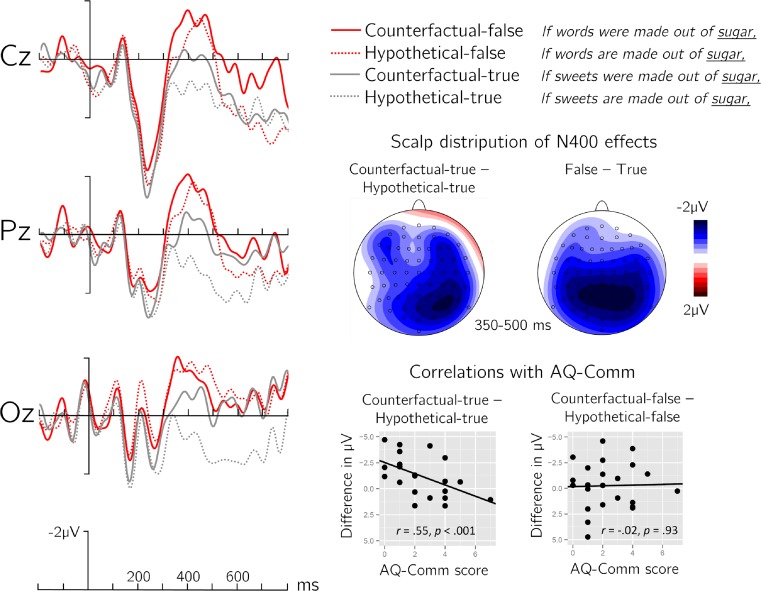
Fig. 2.
ERP results of counterfactual and hypothetical clauses. Left side: Grand average waveforms timelocked to critical word onset for each of the four experimental conditions. Right side middle: Scalp distributions of the mean difference for counterfactual-true minus hypothetical-true (i.e., the mood difference in true conditions) and for false minus true (i.e., the main effect of truth-value). Right side bottom: Correlation of the Autism Questionnaire Communication score (AQ-Comm) with the voltage difference between true conditions (left) and between false conditions (right) elicited over right hemisphere electrodes. (Color figure online)

