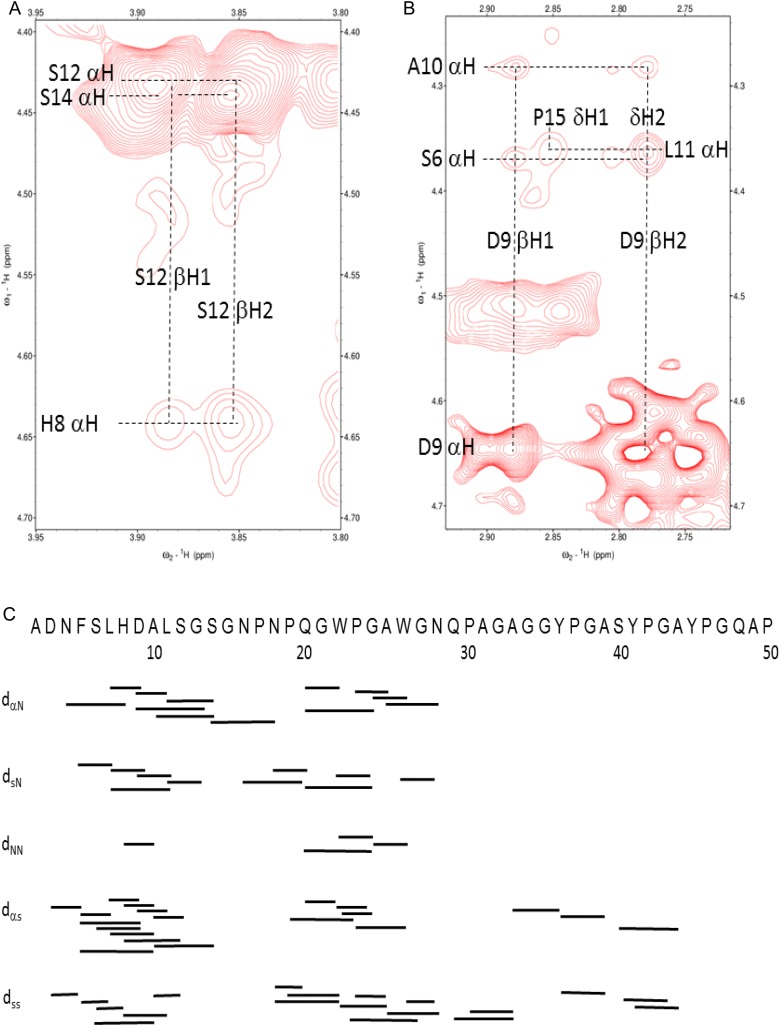
Fig. 2.
(A and B) Two expansions (αβ region) from a 1H NOESY spectrum (1H frequency of 700 MHz NMR, mixing time of 350 ms) of the NT polypeptide 1–50 (∼1 mM) are shown. Several (i,i+ 1), (i,i+ 3) and (i,i+ 4) NOEs are labeled as discussed in the text. (C) A summary of these NOEs observed in NT peptide 1–50 is shown. Resonance assignments for NT peptide 1–50 were made by using standard 1H homonuclear protocols, primarily based on DIPSI and NOESY data recorded at pH 3.3 and 7. NT polypeptides were dissolved as TFA salts and buffer exchanged. Solution conditions are described in Materials and methods. This figure is available in black and white in print and in colour at Glycobiology online.

