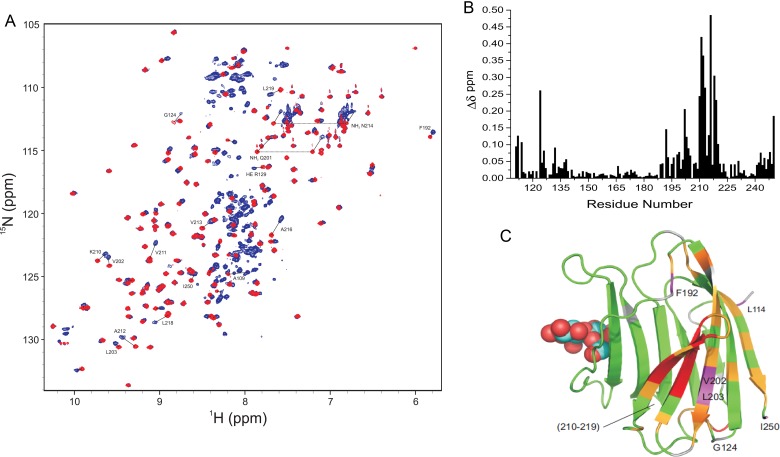
Fig. 3.
(A) 15N–1H HSQC spectra (1H frequency of 700 MHz) of 20 µM 15N-labeled full-length Gal-3 (blue) and 20 µM 15N-labeled Gal-3 CRD (red) are overlaid. Some highly shifted backbone and side chain NH resonances are labeled using assignments previously reported (Ippel et al. 2015). (B) Chemical shift differences (Δδ) of CRD resonances in full-length Gal-3 and Gal-3 CRD are plotted vs. the amino acid sequence of Gal-3 CRD. (C) Δδ values are highlighted in the X-ray crystal structure of Gal-3 CRD. Residues that are most highly shifted are highlighted in red (2 SD above average), followed by orange (1 SD above average), gray (above the average) and green (below the average). The average value was 0.05 ± 0.04 ppm (SD). A molecule of lactose is shown in space-filling format for orientation. Solution conditions are described in Materials and methods. This figure is available in black and white in print and in color at Glycobiology online.

