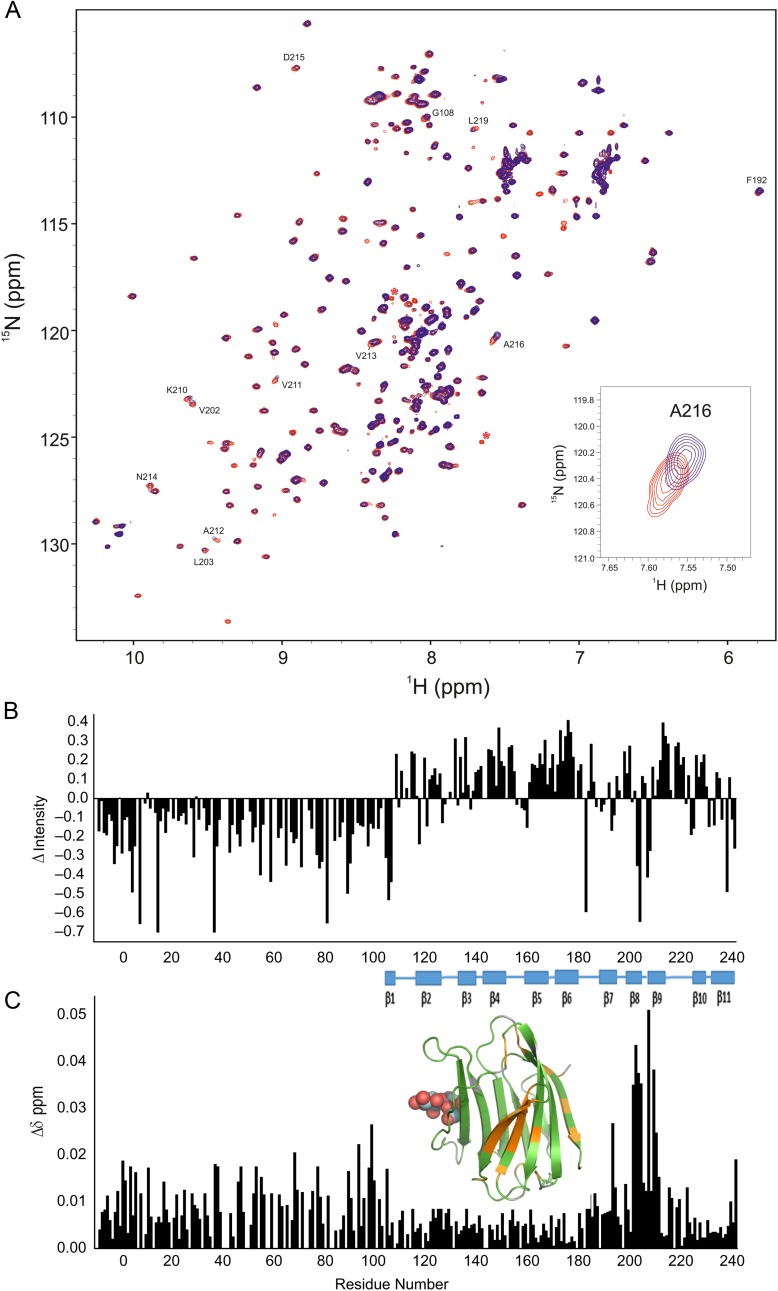
Fig. 9.
(A) 15N–1H HSQC spectra (1H frequency of 700 MHz) obtained with 15N-labeled Gal-3 at 20 µM (blue) and 15N-labeled Gal-3 at 420 µM (red) are superimposed. As discussed in the text, Gal-3 is essentially monomeric at 20 µM, and oligomerizes at increased concentrations. At 20 µM, line widths are rather uniform and narrow for both CRD and NT, unlike those at 420 µM that are differentially broadened. In these presentations, HSQC contour levels were adjusted to accentuate the resonance broadening observed at 420 µM (blue) and to view contours at 20 µM (red). Overall, all resonances are observed at both concentrations. The insert shows an expansion of a region from these overlays of HSQC spectra. (B) Intensity changes (ΔI) of CRD resonances in full-length Gal-3 at 20 and 420 µM shown in (A) are plotted vs. the amino acid sequence of Gal-3. Intensity changes (ΔIntensity) were calculated as (1 − Inti/Into), where Inti is the resonance intensity at 420 µM Gal-3 and Into is the resonance intensity at 20 µM Gal-3. For this comparison, intensities in both spectra were first normalized to the intensities of NH resonances from the first 10 NT residues. (C) Chemical shift differences of CRD resonances in full-length Gal-3 at 20 and 420 µM shown in (A) are plotted vs. the amino acid sequence of Gal-3. Residues showing the largest chemical shift differences (>0.011 ppm) are highlighted in orange on the structure of Gal-3 CRD (insert, PDB code 3ZSJ; Seetharaman et al. 1998). Solution conditions are described in Materials and methods. In addition, 25 mM lactose was added to each sample to neutralize effects from even a small amount of lactose remaining in the higher concentration sample following buffer exchange. This figure is available in black and white in print and in color at Glycobiology online.

