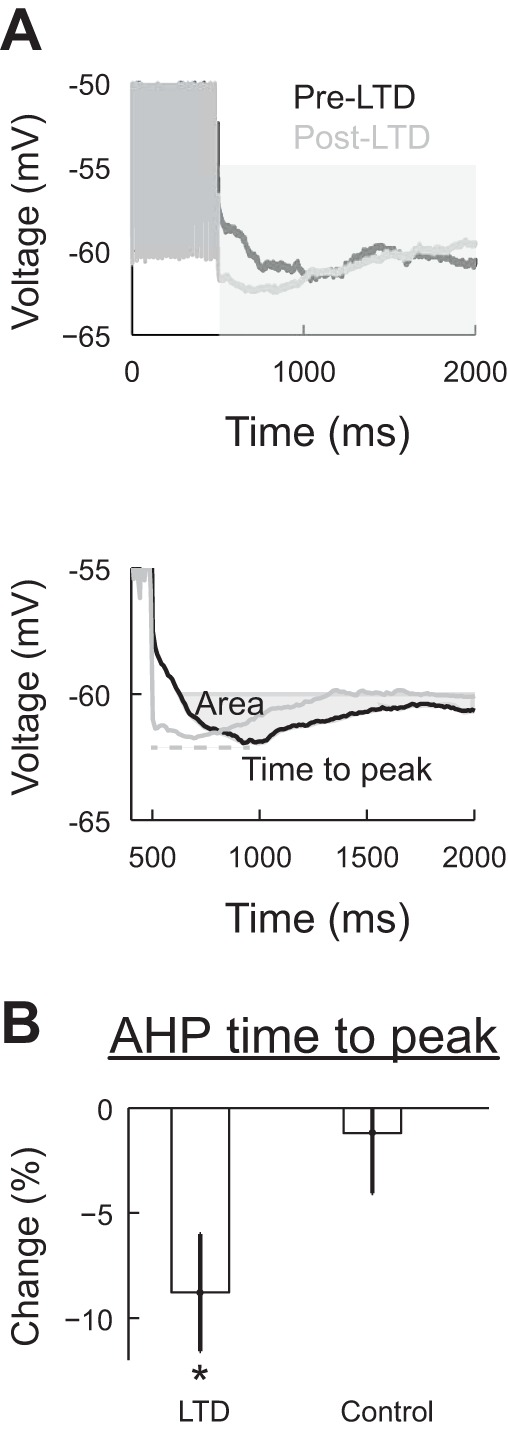
Fig. 5.

The time to peak of the afterhyperpolarization (AHP) decreases after LTD induction. A, top: representative traces of the evoked AHP after a 600-ms, 250-pA stimulation before (pre) and after (post) LTD induction. The gray area shows the section used for the AHP measurements. Bottom, average of four traces before and after LTD induction. The area was measured below the prestimulus potential (−60 mV), and the time to peak was calculated relative to the end of the stimulus. B: comparison of the change in time to peak in the LTD and control groups. Values are means ± SE; n = 7 cells in both groups. *P < 0.05.
